
Trace agent runs
Capture agent runs as readable traces and timelines that show input, LLM reasoning, tool calls, and sub-agents. This helps teams inspect what happened without stepping through raw logs.

Laminar is an open-source observability platform for AI agents to trace runs, detect failures, and run evaluations with Slack alerts and self-hosting.
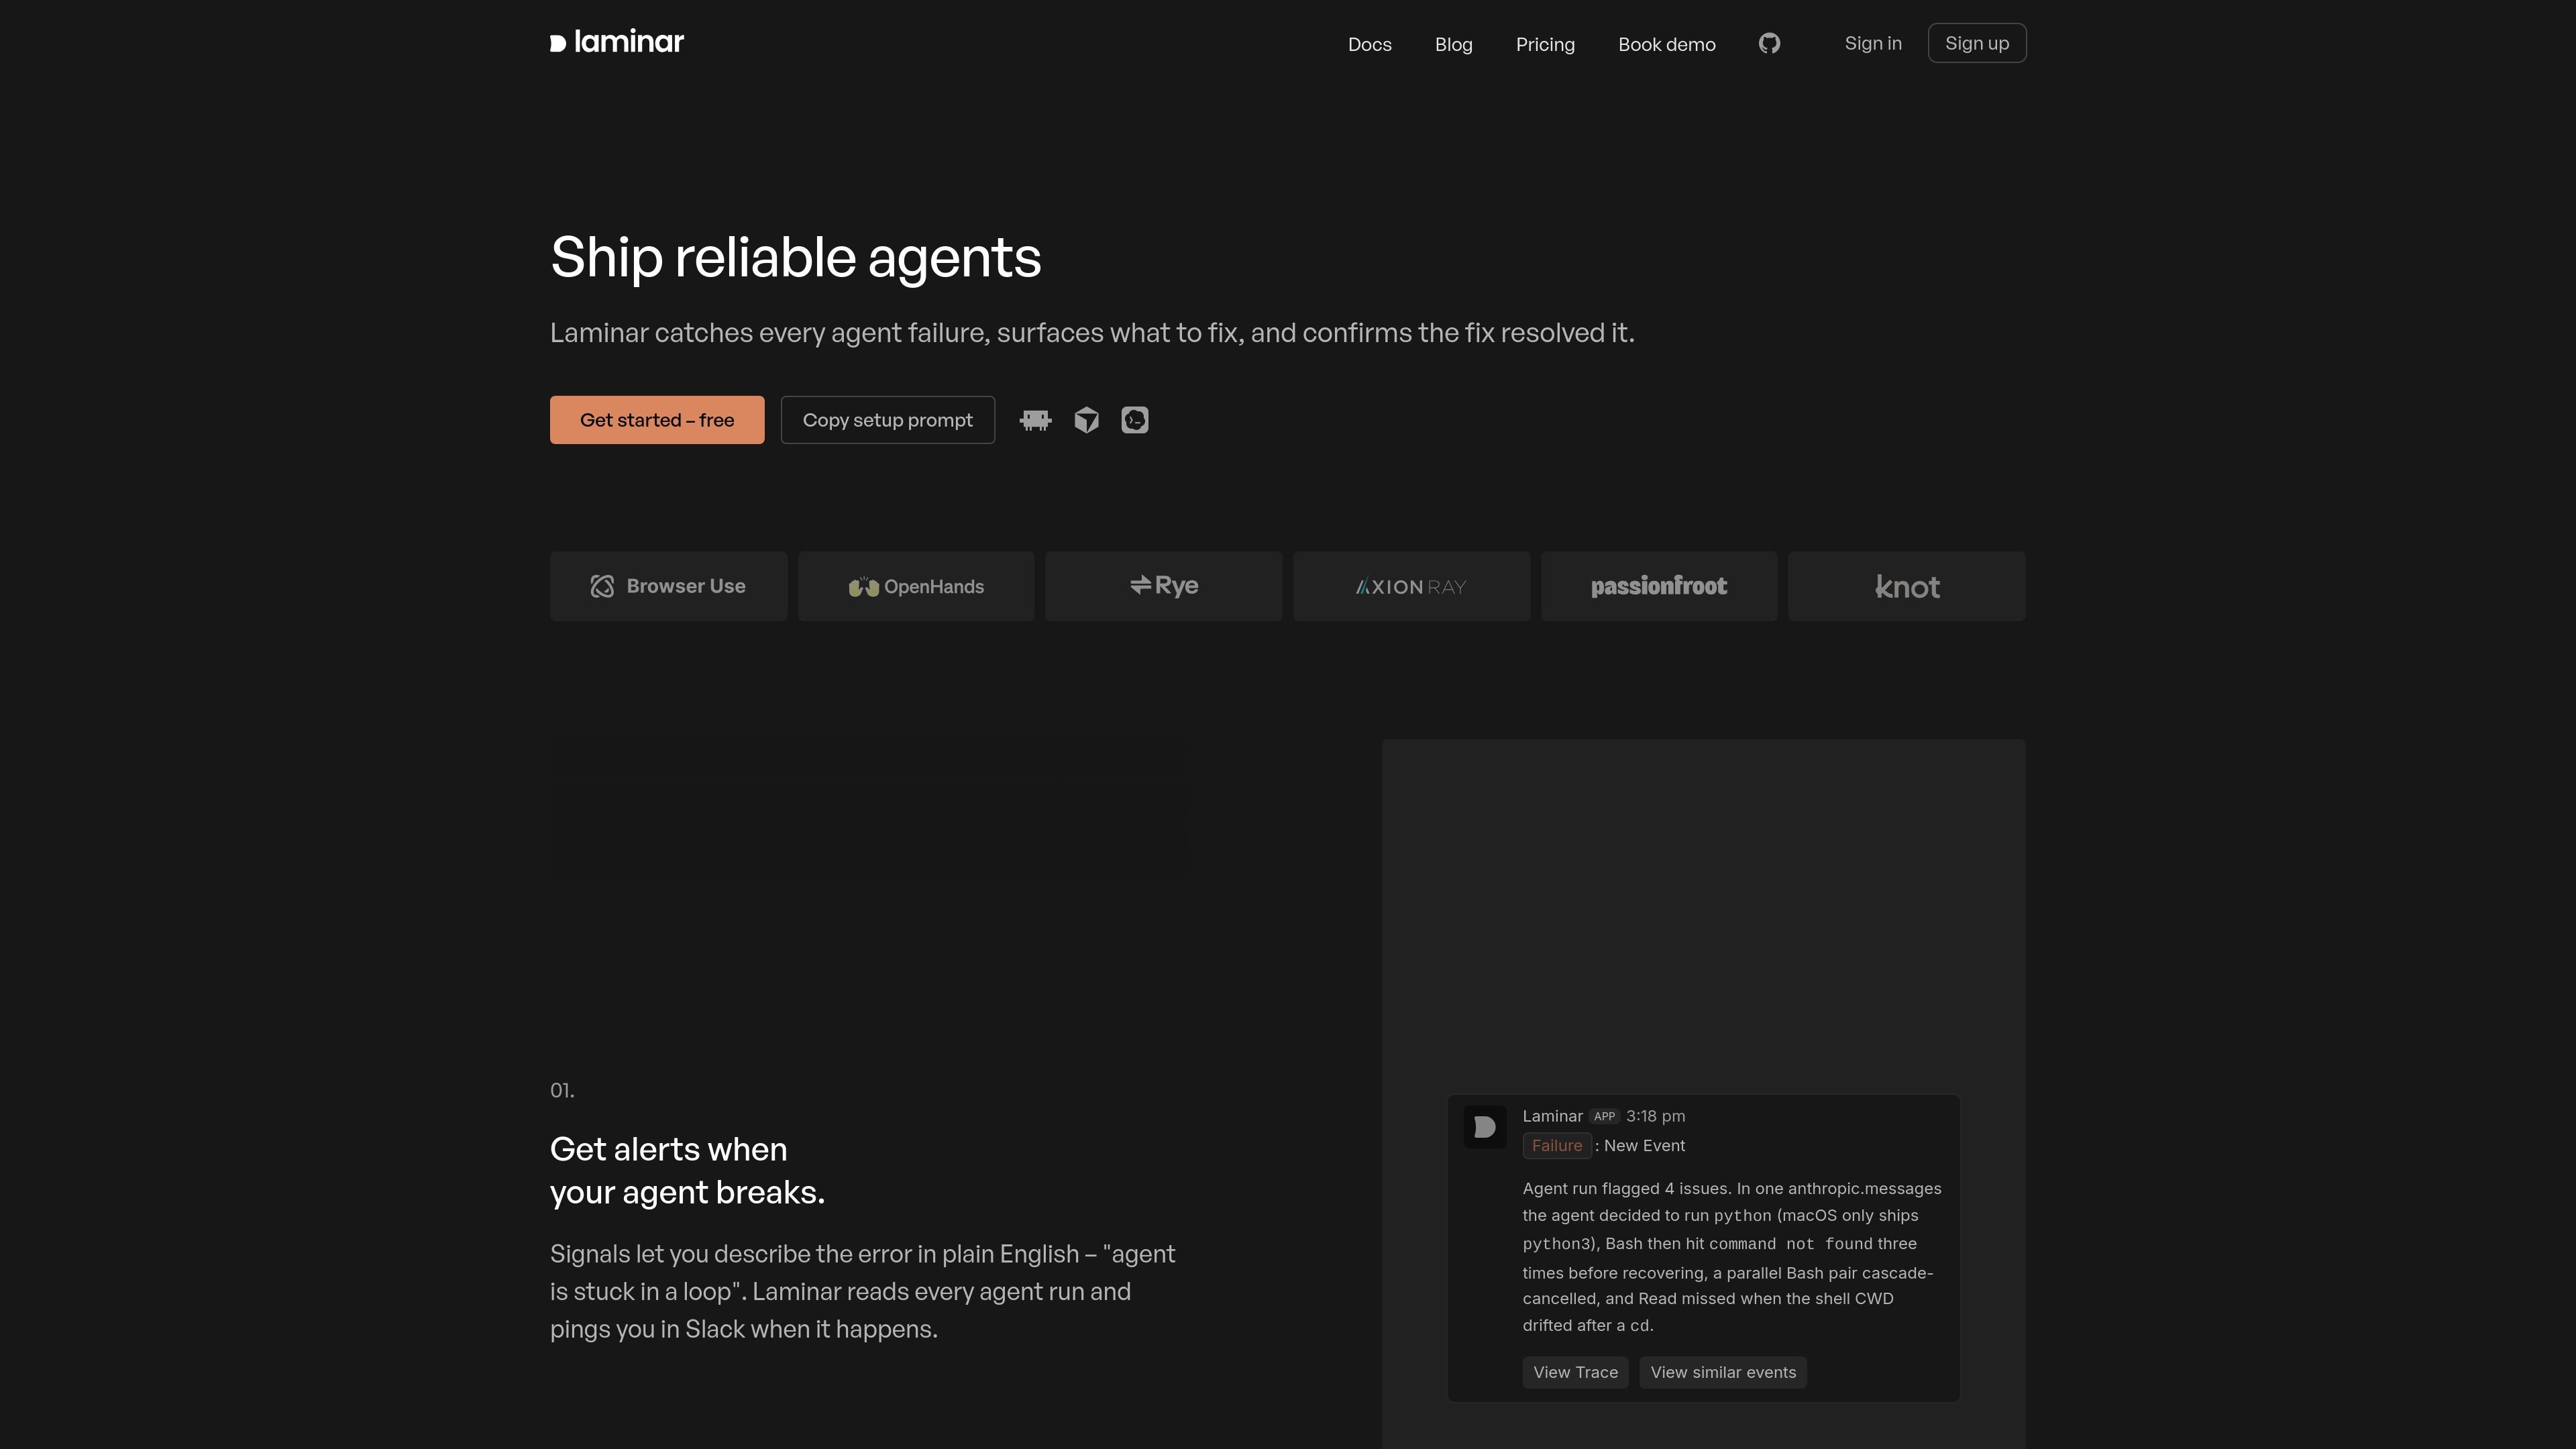
Laminar is an open-source observability platform for AI agents. It is built to trace agent behavior, evaluate changes, and help teams find the exact step where a run went wrong.
The homepage centers the product around three workflows: catching failures with Signals, inspecting runs through a readable transcript and timeline, and turning recurring issues into evaluations. The site also describes developer-oriented capabilities such as a debugger session flow, CLI and MCP access, full-text search, SQL queries, dashboards, and browser session recording.
The pricing page shows free, Hobby, Pro, and Enterprise options, with the public tiers covering trace ingestion, signal usage, retention, support, and platform features. Laminar also lists support for multiple agent SDKs and browser-agent tools, which suggests it is meant to fit into existing AI application stacks.
The site positions Laminar for teams building or operating AI agents that need visibility into failures, repeatable evaluations, and a way to move from issue detection to fixes and regression checks.
Capture agent runs as readable traces and timelines that show input, LLM reasoning, tool calls, and sub-agents. This helps teams inspect what happened without stepping through raw logs.
Describe problems in plain English and let Signals watch for them across runs. Laminar can ping Slack when a run matches the issue, turning recurring failures into alerts.
Group repeated issues into named clusters and track them over time. When a cluster stops recurring, Laminar resolves it and can reopen it if the issue returns.
Turn fixed error clusters into evaluation datasets and run evals after changes to catch regressions. The product page shows this workflow for comparing model or agent behavior across releases.
Use the debugger session flow to run an agent, read the trace, apply fixes, and rerun with cached state. The site also mentions Laminar CLI and MCP for this workflow.
Use Laminar when you need to understand why an agent failed in production. The trace view and Signals workflow help isolate the step, tool call, or model behavior that caused the issue.
Use the product to keep watch for known failure patterns such as loops, wrong directory usage, or repeated command errors. Signals can detect the issue across runs and send Slack alerts when it appears.
Use Laminar when you want a fix-and-verify loop for agent development. The debugger session flow, CLI, and MCP support reruns with cached state so you can inspect and iterate on changes.
Use the platform to turn resolved failures into regression checks. Fixed error clusters can become eval datasets, which helps teams compare behavior before and after a release.
Use the search, SQL, dashboards, and browser recording features when your team needs to analyze traces at scale or review browser-agent sessions as part of debugging and annotation.
Laminar is built to trace AI agent runs, surface failures, and run evaluations so teams can debug and improve behavior over time. The homepage also describes Signals for alerting and cluster tracking for recurring issues.
The product page says Laminar makes agent runs navigable through a transcript and timeline that surface input, LLM reasoning, tool calls, and sub-agents. It also offers a debugger flow that can rerun agents with cached state.
The pricing page lists a free plan, Hobby, Pro, and Enterprise. Enterprise is custom priced with custom limits and on-premise deployment, while the public plans show different data, signal, retention, and support tiers.
The site lists integrations and compatibility with Claude Agent SDK, OpenAI Agents SDK, Mastra, Pydantic AI, LangChain, OpenHands SDK, Browser Use, Stagehand, Playwright, Anthropic, OpenAI, and LiteLLM. It also mentions Laminar CLI and MCP access.
The pricing page notes features such as OTLP trace ingestion, full-text trace search, custom dashboards, SQL access, datasets, labeling queues, browser session recording, agent debugger, MCP access, and Slack and email alerts. The homepage also highlights Slack alerts for Signals.