
AI-generated diagrams
Create diagrams from text prompts, then refine them on the canvas. The source pages also mention Lucid AI for generating content and summaries inside Lucidchart.

Lucidchart is a web-based diagramming platform for creating flowcharts, org charts, process maps, technical diagrams, and system visuals. It supports AI-assisted diagram generation, data-linked charts, and real-time collaboration for teams.
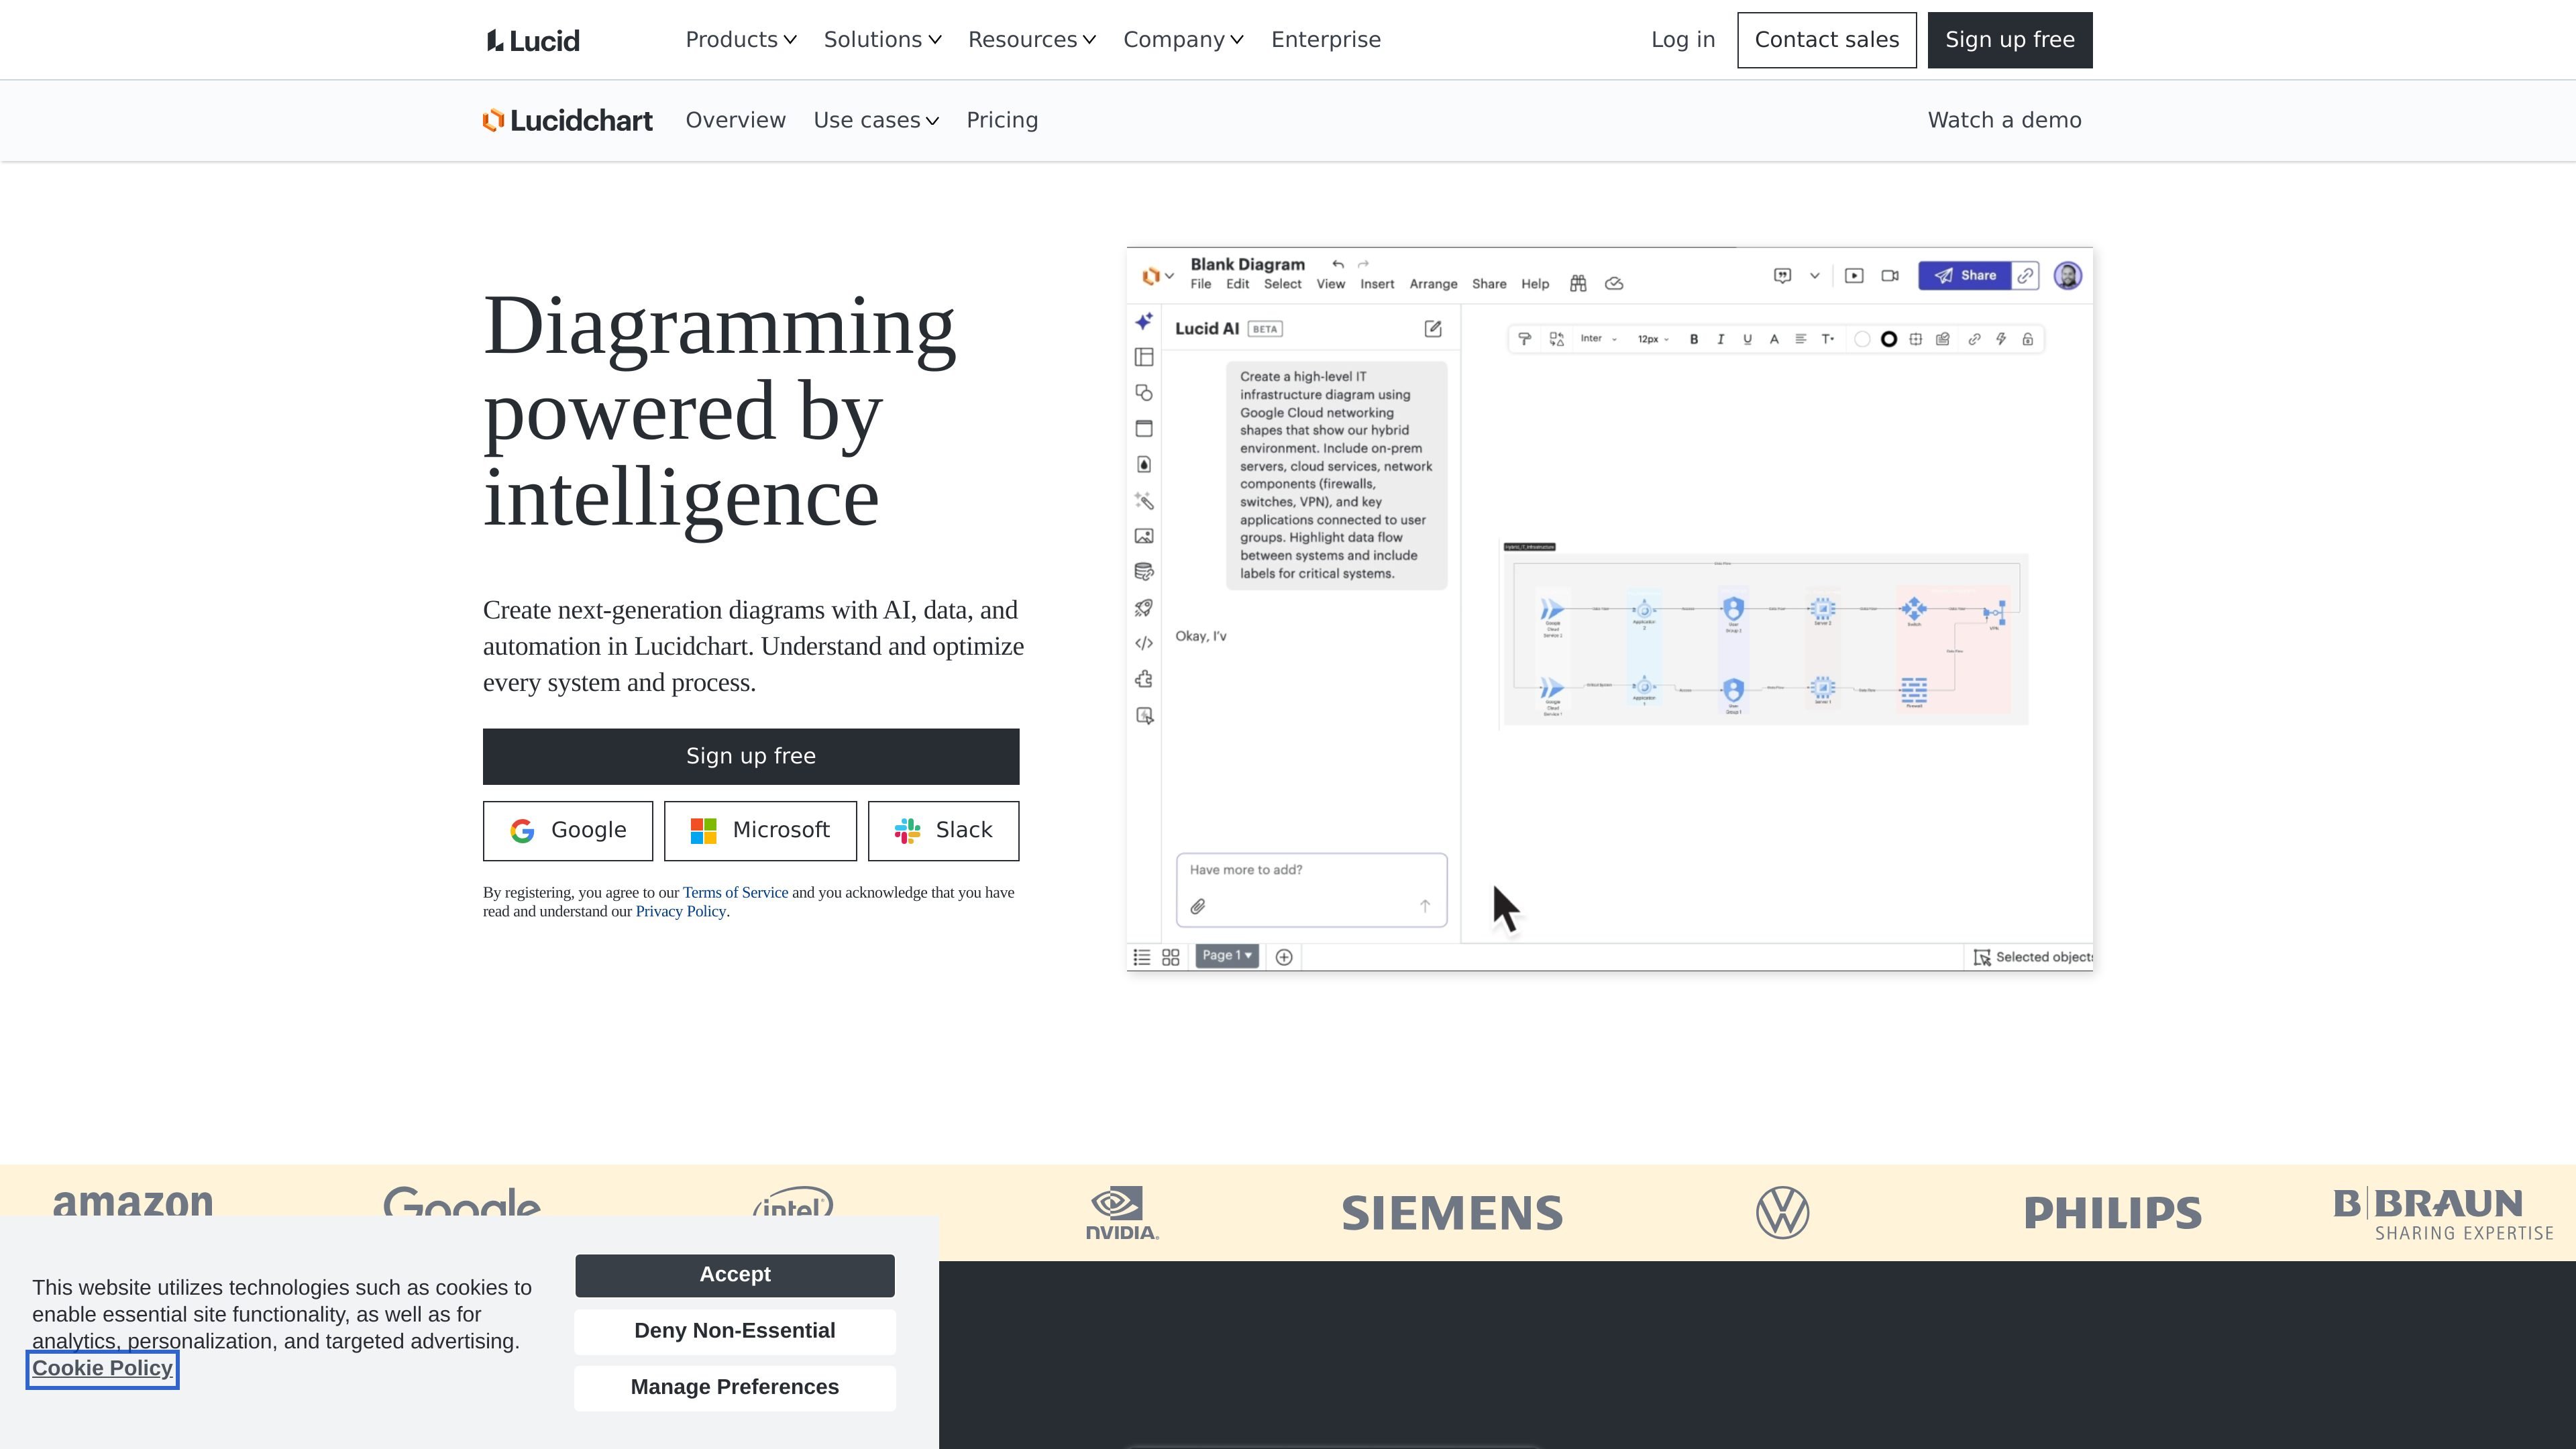
Lucidchart is a diagramming platform for building visual documentation, flowcharts, org charts, technical diagrams, and system maps. The product site positions it as “diagramming powered by intelligence,” combining AI, data imports, automation, and collaboration so teams can create and maintain diagrams more efficiently.
Across the site, Lucidchart is presented as a tool for making complex work easier to understand and update. Users can generate diagrams from text prompts, import data to create charts automatically, collaborate in real time, and connect diagrams to popular work apps to keep documentation aligned with current processes and team structures.
Create diagrams from text prompts, then refine them on the canvas. The source pages also mention Lucid AI for generating content and summaries inside Lucidchart.
Connect Lucidchart to data sources such as Google Sheets, Excel, CSV, and imported HR data to build visuals from live or structured information.
Edit diagrams at the same time, leave comments, tag collaborators, and use revision history to review or roll back changes.
Use diagram-as-code features such as Mermaid-based generation for process maps and flowcharts, which can reduce manual setup for structured visuals.
Apply conditional formatting, layers, group view, and assisted layout to make complex diagrams easier to read and manage.
Connect Lucidchart with external apps through integrations and embedded workflows across tools such as Google Workspace, Microsoft 365, Slack, Jira, Notion, Salesforce, and BambooHR.
Map workflows, define handoffs, and keep a shared visual record of how a process works. The platform supports flowcharts, quick diagramming, conditional formatting, and diagram-as-code for structured process documentation.
Create org charts from CSV imports or HR data, link them to live data, and use group view or layers to show reporting lines and team structure without losing clarity.
Turn text prompts into diagrams, refine them with AI on the canvas, and summarize selected objects when teams need a fast first draft or a readable explanation.
Document systems, infrastructure, and architecture with cloud shape libraries, linking and embedding, and other tools that help centralize technical documentation.
Use comments, tagging, real-time editing, and revision history to keep diagrams current when several people need to review or update the same document.
Lucidchart can be used without starting from a blank canvas: the source pages describe AI-generated diagrams, templates, and imports from data sources such as CSV, Google Sheets, and Excel. It also supports diagram-as-code for process maps and flowcharts using Mermaid coding.
Yes. The source pages describe real-time collaboration on diagrams, including shared editing, comments, tagging collaborators, revision history, and the ability to keep documents current as teams update them.
Lucidchart is positioned for diagramming systems, processes, org structures, technical diagrams, and architecture. The use-case pages highlight process maps and flowcharts, AI-generated diagrams, and org charts for Agile teams and organizational planning.
The pricing page confirms there is a free and premium pricing structure, but the provided source text does not include plan limits or prices. The product pages also point to contact sales for some workflows.
The source pages mention integrations with Google Workspace apps, Microsoft apps, Slack, Jira, Notion, Salesforce, BambooHR, Confluence, and others. For specific app support, the integrations pages would need to be checked directly.