
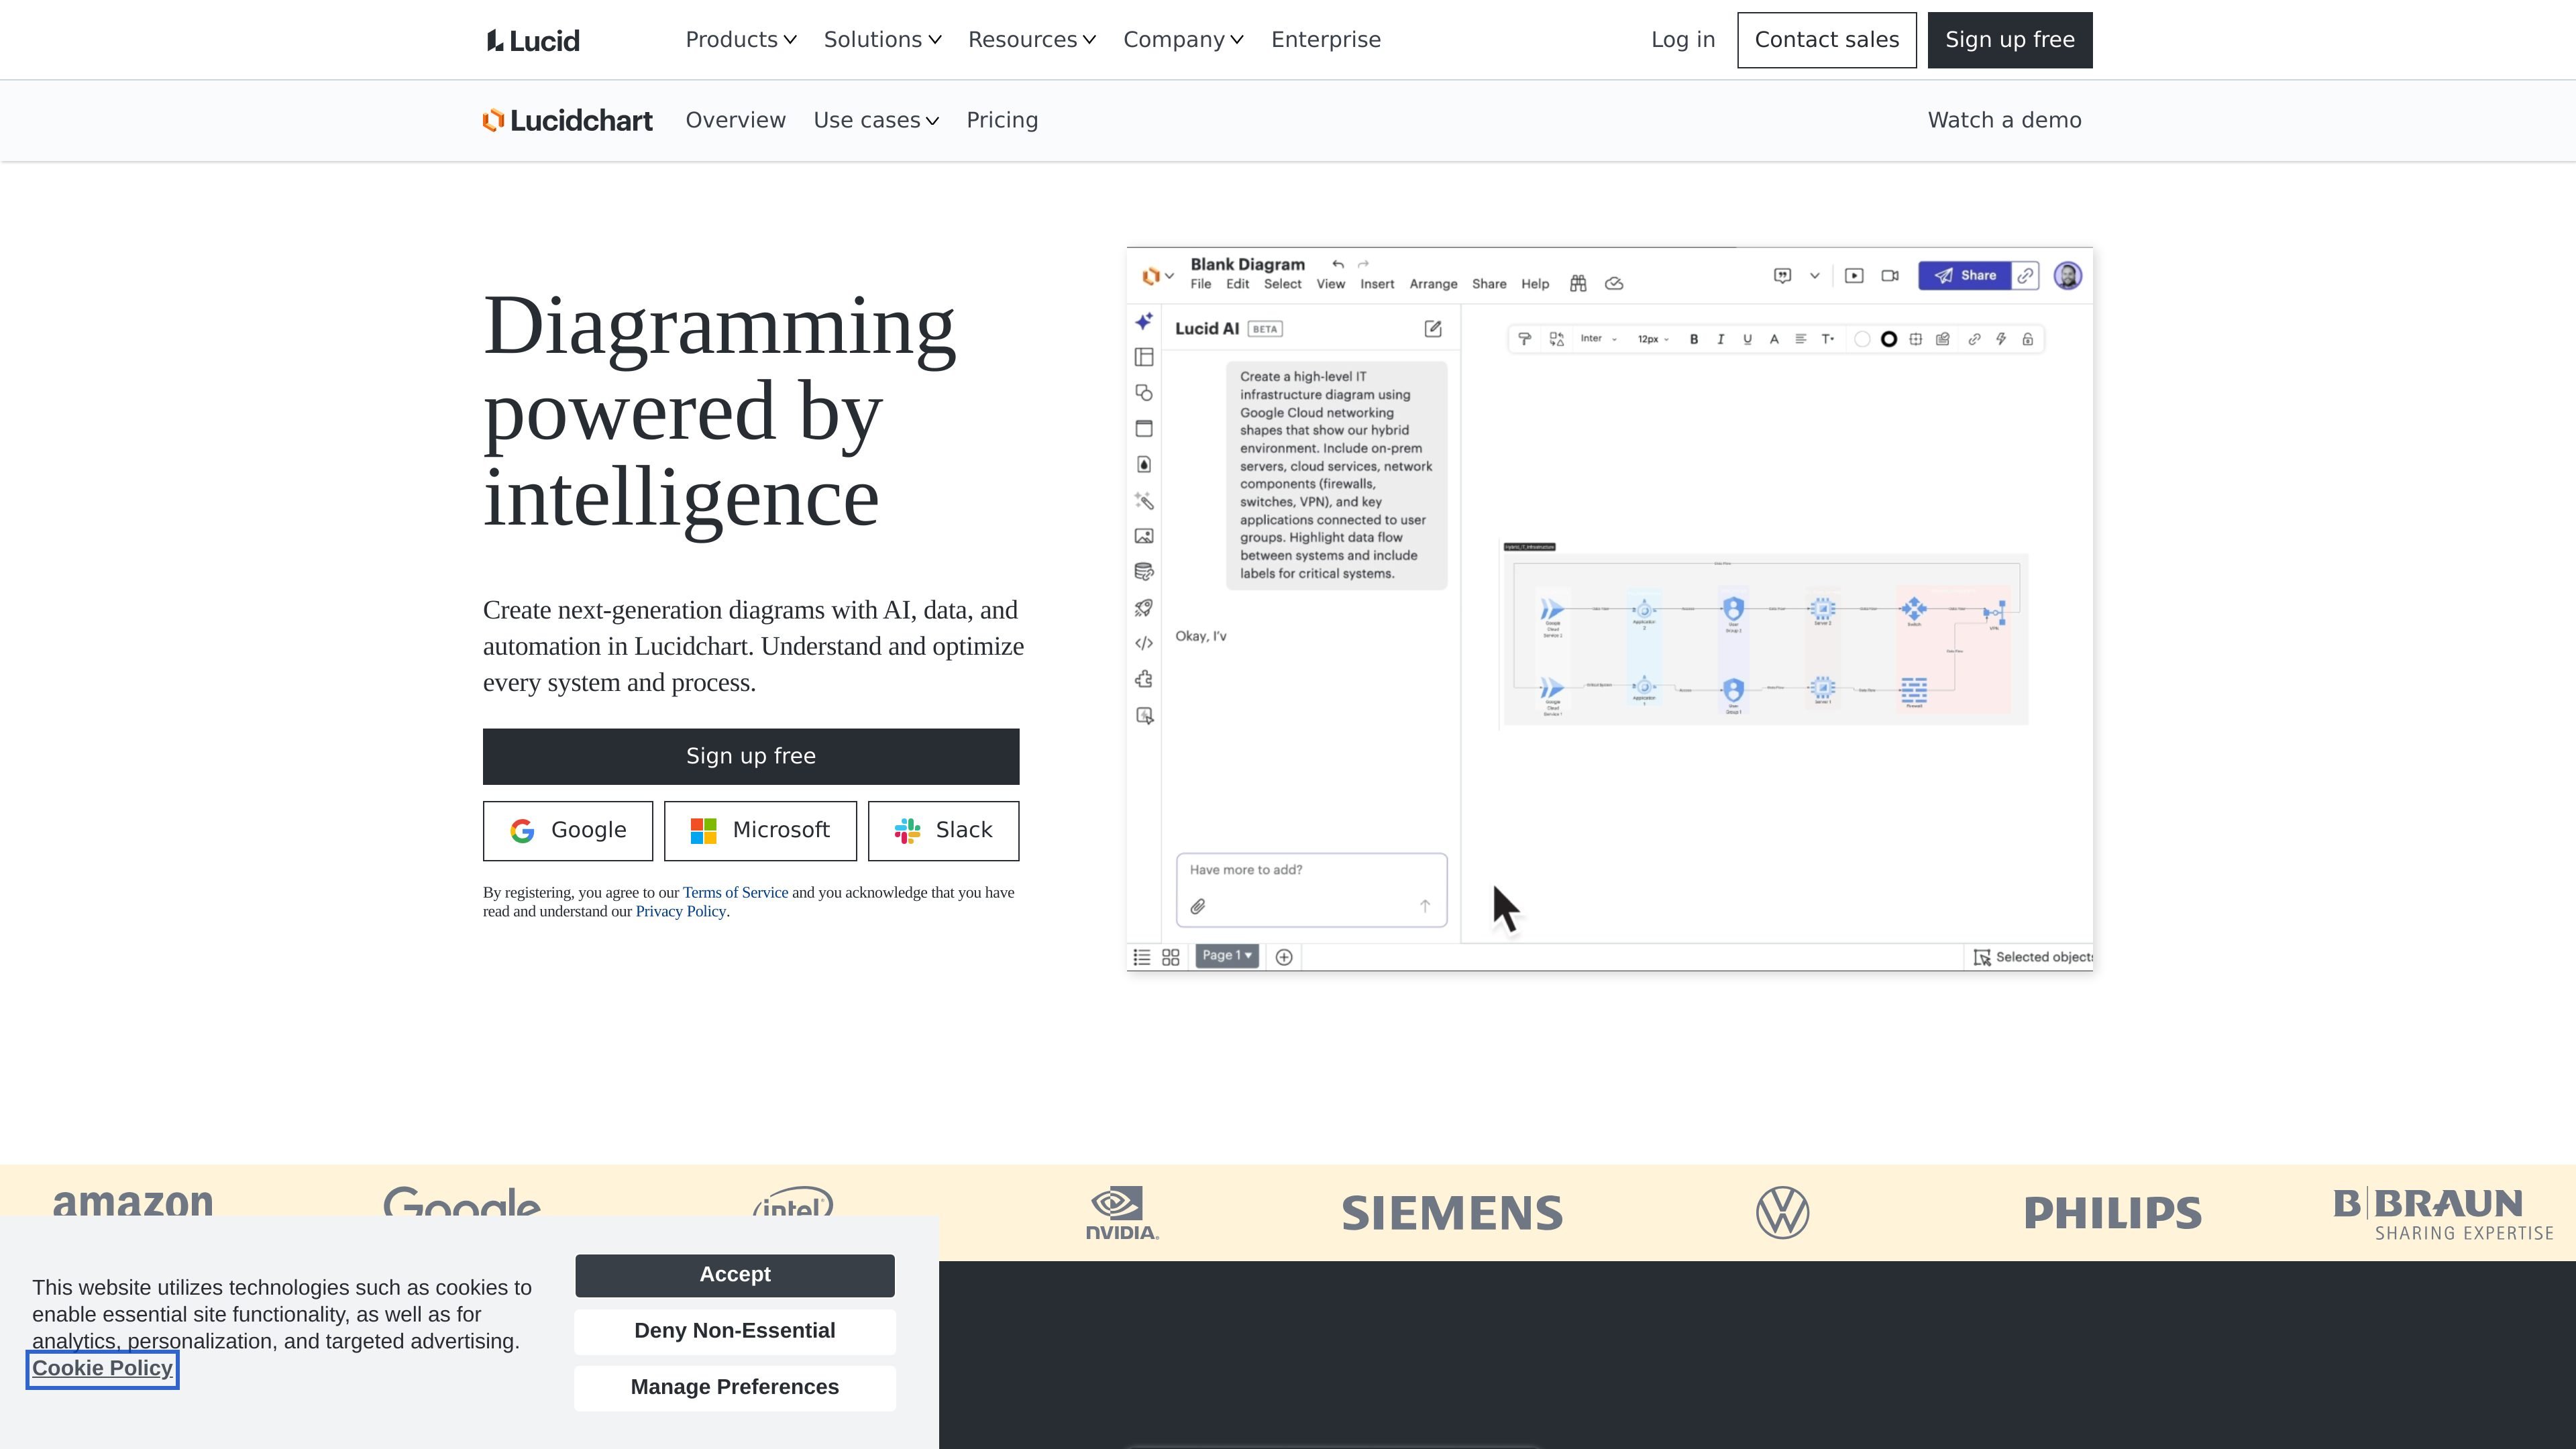
Prompt-to-diagram drafting
Describe a flowchart, ERD, mind map or org chart in Lucid AI. Continue with a prompt to modify an existing diagram; Plan mode can ask clarifying questions before making changes.

Build process maps, org charts and technical diagrams from templates, text prompts or data, then edit and collaborate on a shared canvas.
Lucidchart is a browser-based workspace for creating flowcharts, organizational charts, process maps and technical diagrams. Start with a template, draw on the canvas, generate a draft from a text description, or link structured data to a visualization. Teams can work on the same diagram in real time.
Lucid AI can draft and revise diagrams, summarize content and export documents. It is currently in beta and optimized for English. Feature access depends on the account: Free provides limited basic editing, while paid subscriptions unlock premium capabilities such as editing imported diagrams.
Describe a flowchart, ERD, mind map or org chart in Lucid AI. Continue with a prompt to modify an existing diagram; Plan mode can ask clarifying questions before making changes.
Link Google Sheets, Excel or CSV data to visualizations. Org-chart views, conditional formatting and layers help present relationships and distinguish parts of a complex diagram; access varies by plan.
Collaborate on the same diagram in real time, using process, organization and technical templates as starting points for shared documentation.
Import supported Visio, Gliffy, Draw.io and OmniGraffle files. Free users can import and view them; editing imported diagrams requires an Individual, Team or Enterprise subscription.
Export documents as PDF, PNG, JPEG or SVG through Lucid AI. Diagram-image imports can also be reconstructed into editable canvas shapes from compatible JPEG or PNG files.
Draft a flowchart from a process description, refine the steps on the canvas and collaborate with the people responsible for its handoffs.
Use structured employee data to create org charts and show team relationships, with data-linking and view capabilities appropriate to the account.
Create system, architecture or ER diagrams, reuse supported drawings from other tools and export visuals for documents or presentations.
Yes. Free provides limited access to basic Lucidchart features, including limits on editable documents and objects per document. Individual and Team provide premium access; Enterprise combines Lucidchart and Lucidspark in the Lucid Suite.
Free accounts can import and view supported external diagrams. Editing those imported documents requires an Individual, Team or Enterprise subscription. Visio, Gliffy, Draw.io and OmniGraffle imports must use compatible file formats.
Lucid AI is currently in beta and optimized for English. It is available on Free, Individual, Team and Enterprise accounts, but not FedRAMP accounts. Team and Enterprise admins can disable AI features for their account.
No. Direct PDF import as an editable diagram is not supported. For diagram-image reconstruction into editable shapes, the supported image inputs are JPEG and PNG.
Traffic data is for reference only.

edrawmax.com
Create diagrams from a blank page or an existing Edraw file, arrange symbols and text, and export the result from a browser-based editor.

piccollage.com
PicCollage is a photo and video collage creation app with templates, editing tools, stickers, text, and backgrounds. It helps people make greeting cards, digital scrapbooks, social posts, memory pages, and video recaps on iOS, Android, or in a web browser.