
Multiple ways to add data
Connect a live Google Sheet, upload a CSV or Excel file, paste or type values, use the API, or ask AI to search for data. Graphy is set up to ingest data without requiring heavy preparation first.

Graphy is a web-based charting tool for turning spreadsheet, file, API, or AI search data into shareable graphs and dashboards.
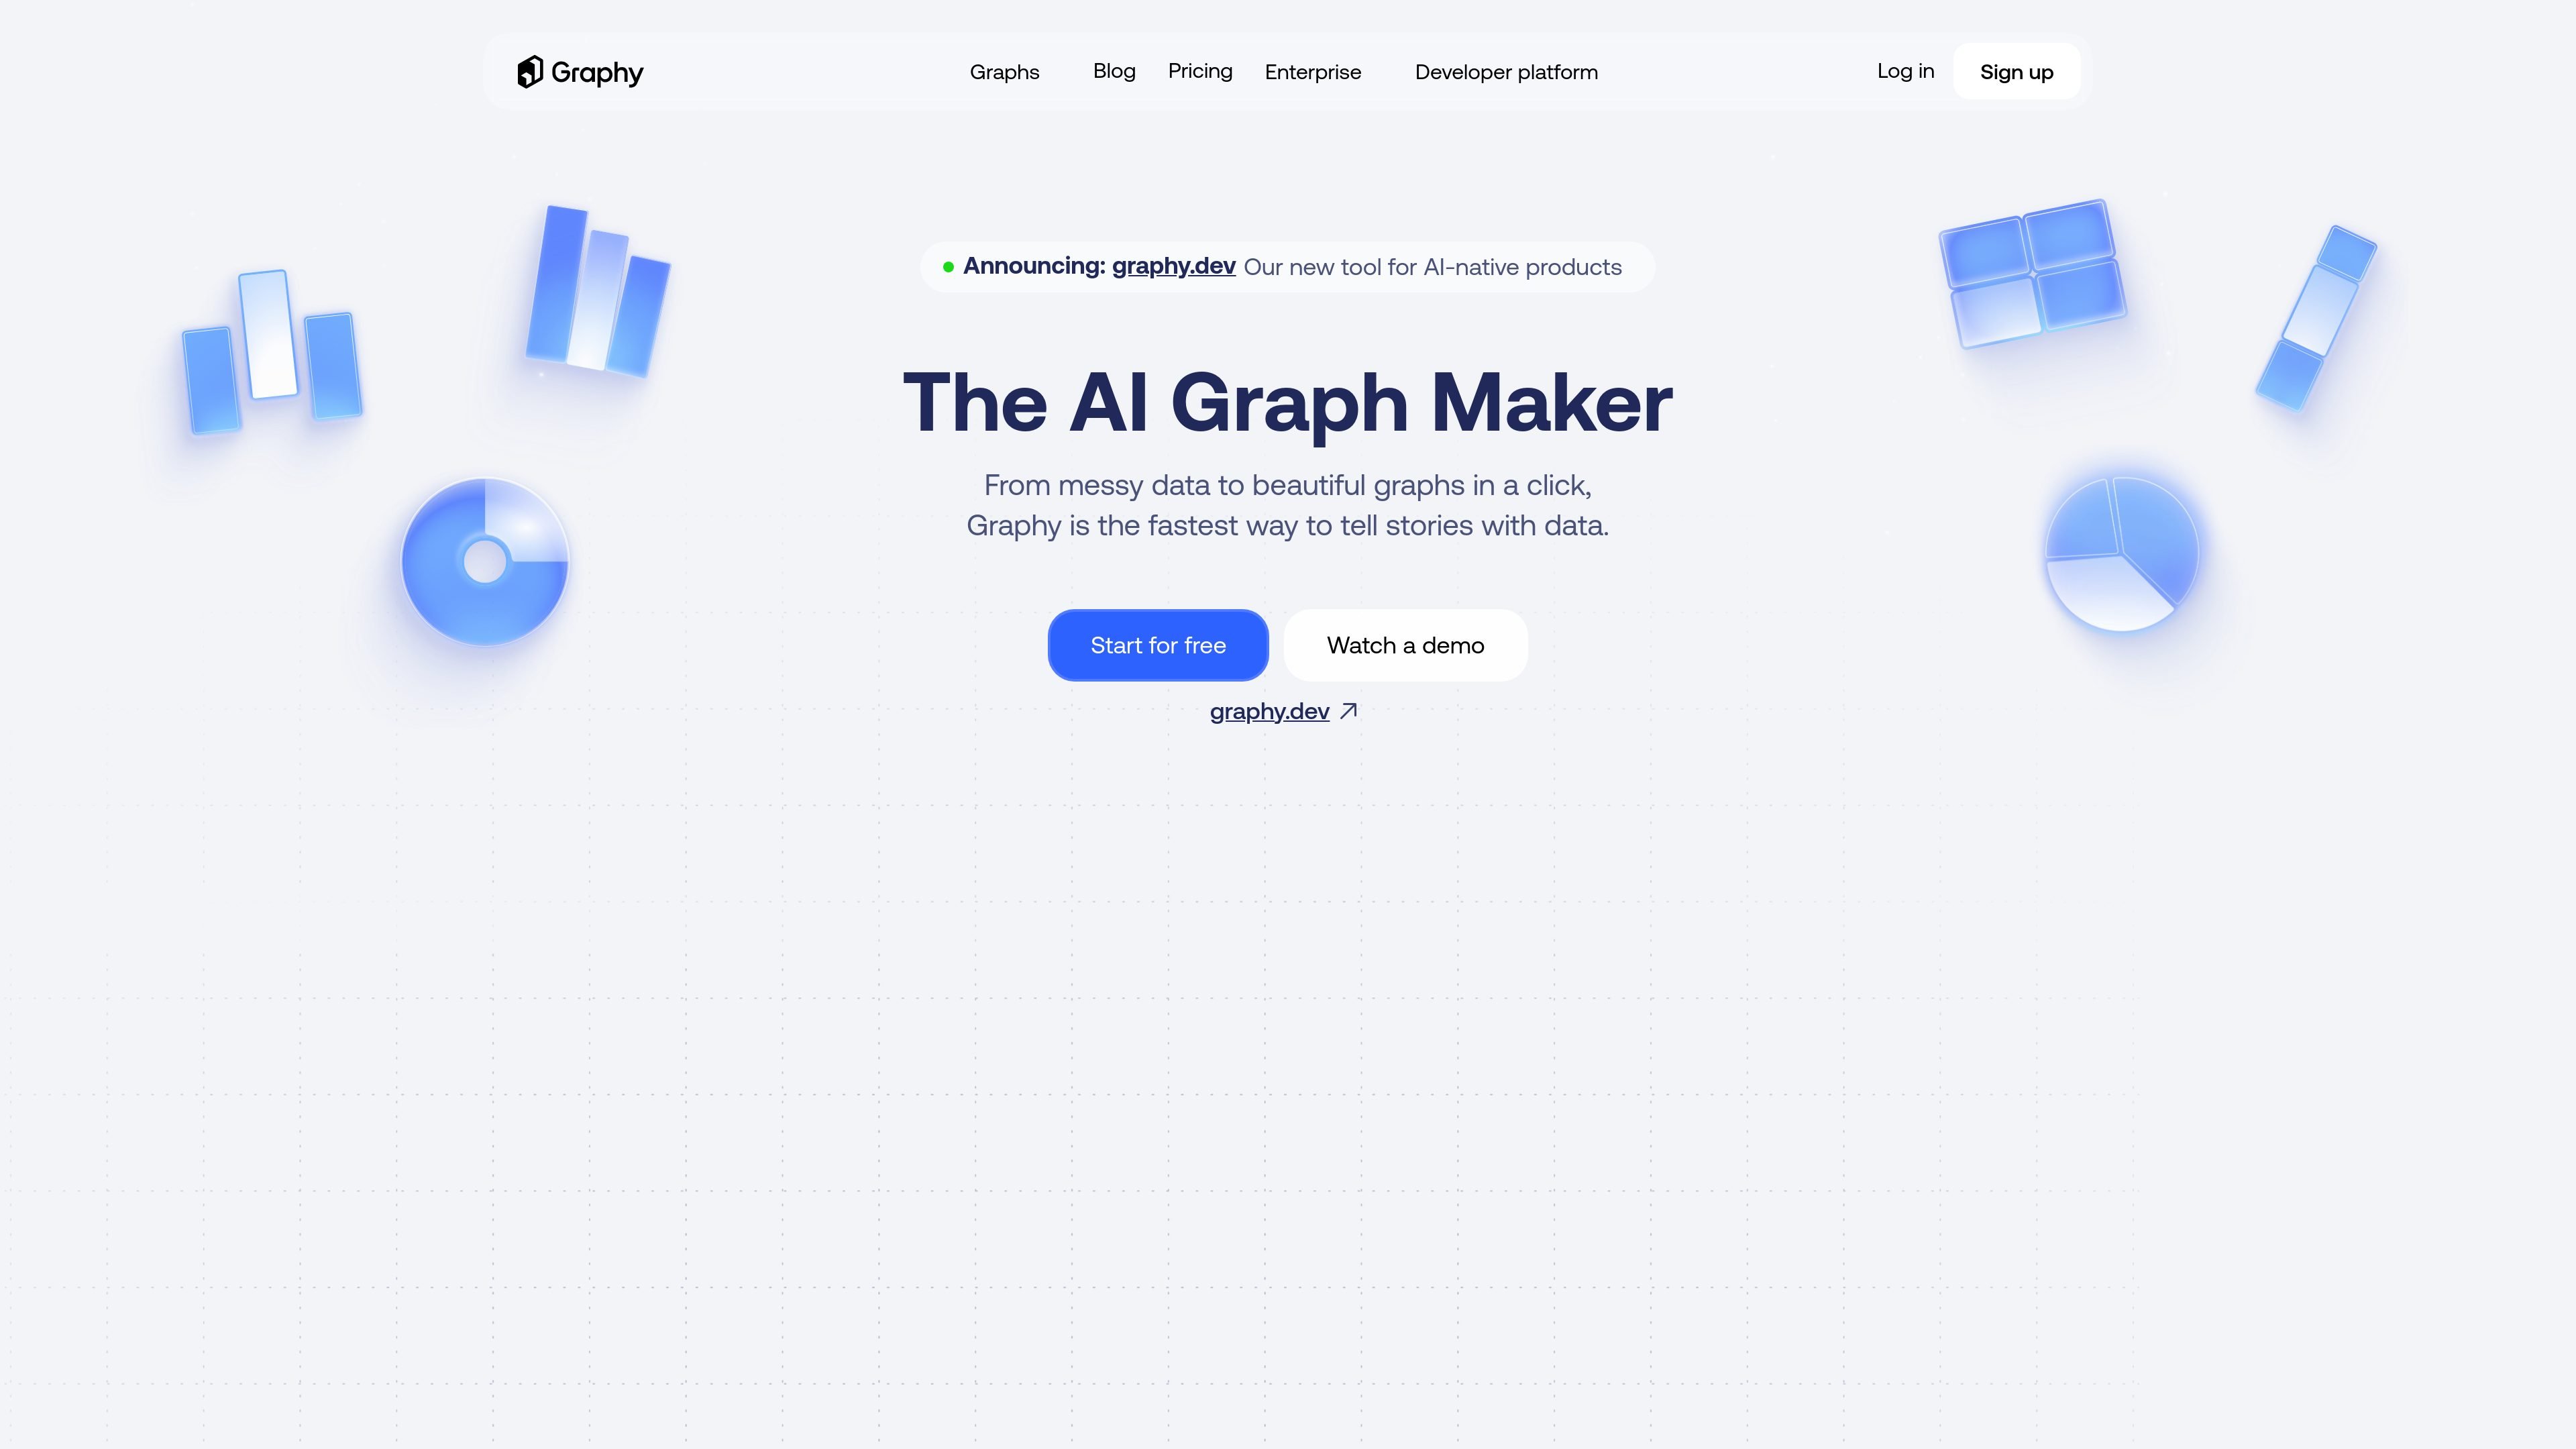
Graphy is a web-based graph maker and charting platform that turns raw data into visual reports. The site positions it as a fast way to move from messy data to graphs that are ready to share, embed, or present.
It accepts several input formats, including live Google Sheets, CSV and Excel files, typed values, API data, and AI-powered data search. Graphy then uses AI to suggest charts, surface takeaways, and help users present data with branding, annotations, and sharing options.
Connect a live Google Sheet, upload a CSV or Excel file, paste or type values, use the API, or ask AI to search for data. Graphy is set up to ingest data without requiring heavy preparation first.
Graphy’s AI inspects the dataset and suggests the clearest charts, then adds headline takeaways. The site says you can also chat with your data to get the right chart, insight, or answer.
Apply your colors, fonts, and style to charts so the output matches your brand. The pricing page also lists brand kits and custom colors on higher plans.
Use Graphy to export or embed charts, or share them in slides, social posts, docs, and team updates. The automation page also mentions shareable dashboards, PDF or PowerPoint export, and live presentation mode.
The pricing page describes an API and charting SDK for building editable, story-driven data experiences inside a product. The automated charts page also calls out REST API integrations.
Build charts for investor updates, board memos, and internal reporting when you need to move quickly from live data to a polished visual.
Create client-ready dashboards and branded reports for agencies or consultants managing multiple data sources and presentation formats.
Turn metrics into slides, social posts, docs, or embedded charts that are easier for non-technical audiences to read and share.
Use REST API or the charting SDK to add editable, story-driven charts inside a product or workflow.
Keep charts current from live data sources and use annotations, templates, and presentation mode for recurring updates.
Graphy accepts live Google Sheets, CSV and Excel uploads, pasted or typed values, API input, and AI-powered data search. The home page also says it can generate charts automatically from those inputs.
The pricing page shows a Free plan, plus paid Plus and Business plans. It also says Graphy can be used for free where you want to share interactive charts, with upgrades for more charts, more AI use, and watermark removal.
The source pages show export and embed options, plus shareable dashboards and live presentation mode on the automation page. The pricing page also mentions password-protected links on the Business plan.
The source emphasizes internal reporting, investor updates, client-facing reports, slides, social posts, docs, and dashboards. It does not provide a full list of every supported destination or file format on the pages reviewed.