
AI-generated visual content
Generate charts, diagrams, infographics, and visualizations with AI from a single web app.
ChartAI is a web-based AI tool for charts, diagrams, infographics, and visuals for presentations, papers, and projects.
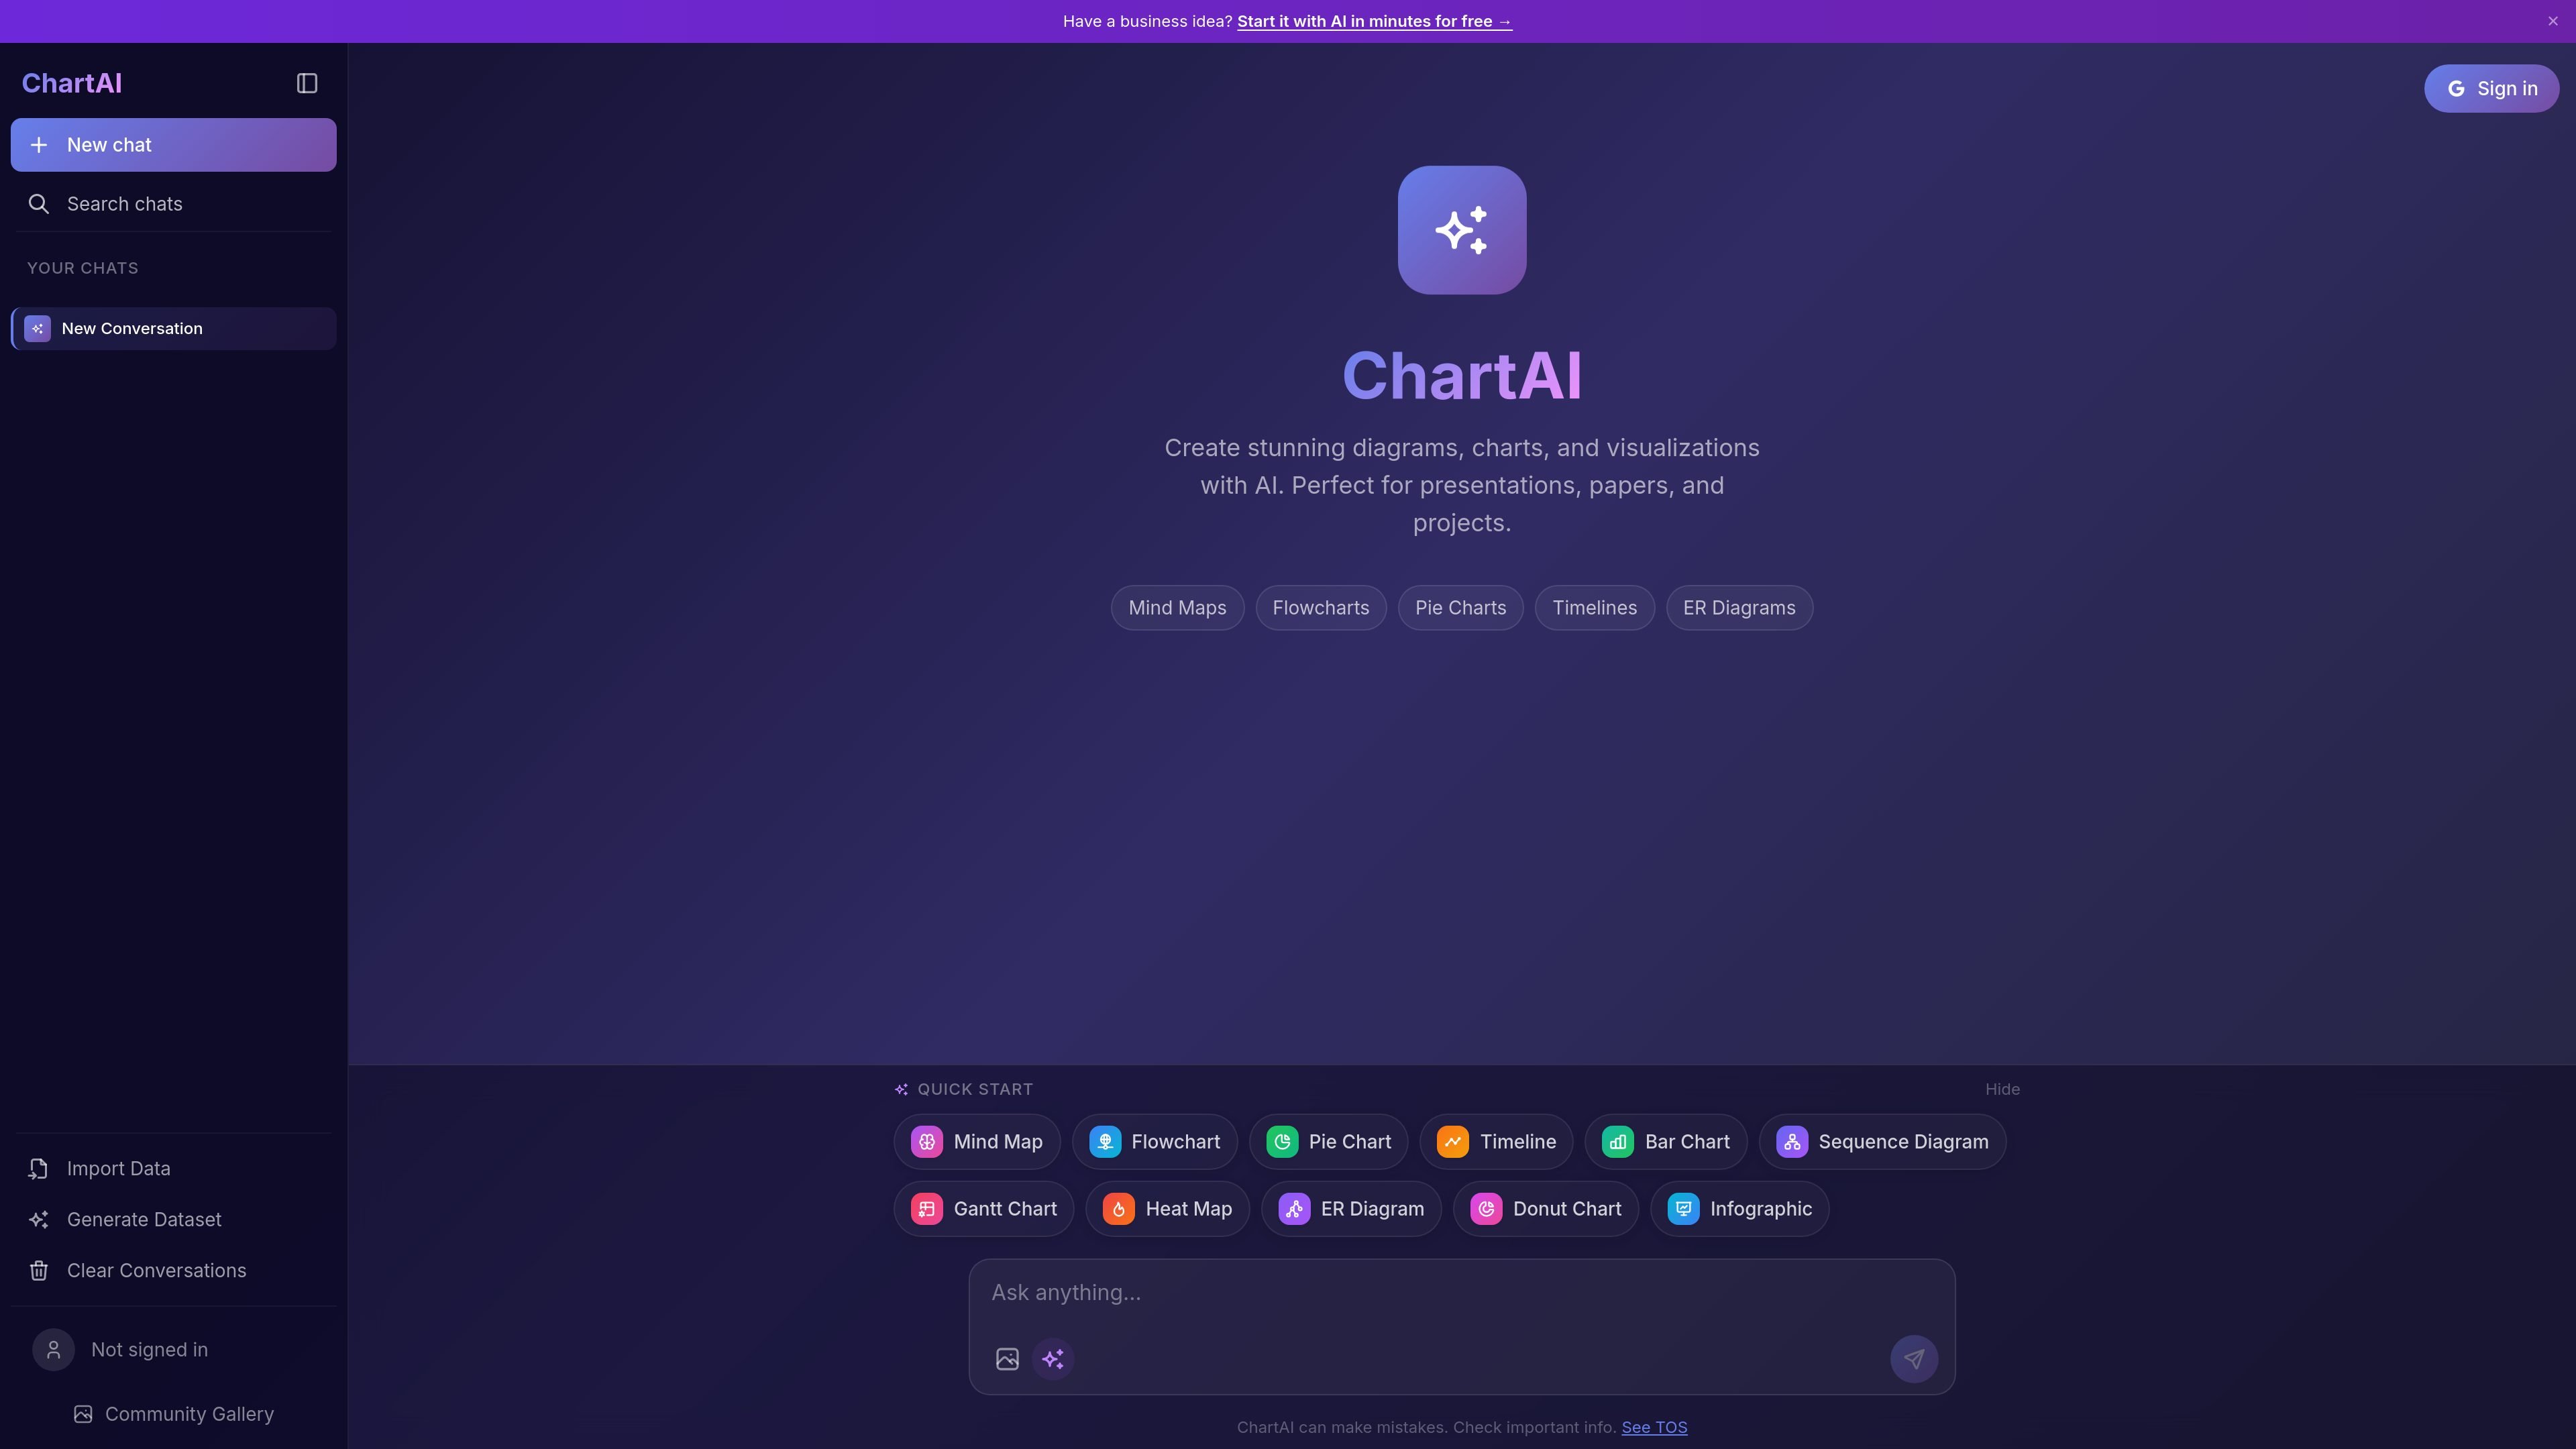
ChartAI is a web-based AI tool for creating charts, diagrams, infographics, and other visual content. Its home page describes it as “ChatGPT for charts and diagrams,” and positions it for presentations, papers, and projects.
The product centers on a prompt-driven workflow for turning ideas or data into visual outputs. The public site highlights a range of diagram and chart formats, while the terms document confirms account-based access, credit consumption for generation, and additional AI capabilities such as synthetic data generation, white paper creation, and image analysis.
Generate charts, diagrams, infographics, and visualizations with AI from a single web app.
The home page highlights a quick-start set that includes mind maps, flowcharts, pie charts, timelines, bar charts, sequence diagrams, Gantt charts, heat maps, ER diagrams, and donut charts.
The interface includes a community gallery so users can browse examples created with ChartAI.
The terms state that the service includes synthetic data generation, white paper creation, and image analysis among its features.
The service operates on credits, which are consumed when generating AI content; unused credits do not expire.
Create diagrams and charts for slide decks, academic papers, and project updates when you need a visual quickly and do not want to build it manually.
Turn a rough idea into a structured flowchart, mind map, or timeline for planning work, explaining a process, or organizing research.
Browse the community gallery for examples and use the same general formats as starting points for your own work.
Generate visual representations such as ER diagrams, sequence diagrams, heat maps, or Gantt charts when the output needs a more specific data or process structure.
Use the product’s additional AI workflows, such as synthetic data generation or image analysis, where those capabilities fit the task.
ChartAI is an AI-powered data visualization and diagram generation platform. It lets users create charts, diagrams, infographics, and other visual content from within the product.
The source shows chart and diagram creation, plus related capabilities such as synthetic data generation, white paper creation, and image analysis in the terms.
The public site and terms indicate an account is needed for some features, and the service uses a credit-based system for generation. The available sources do not show a pricing page, so pricing details are not publicly confirmed here.
The gallery shows examples such as mind maps, flowcharts, timelines, bar charts, pie charts, heat maps, ER diagrams, sequence diagrams, and Gantt charts. The home page also presents a quick-start list of these chart types.