
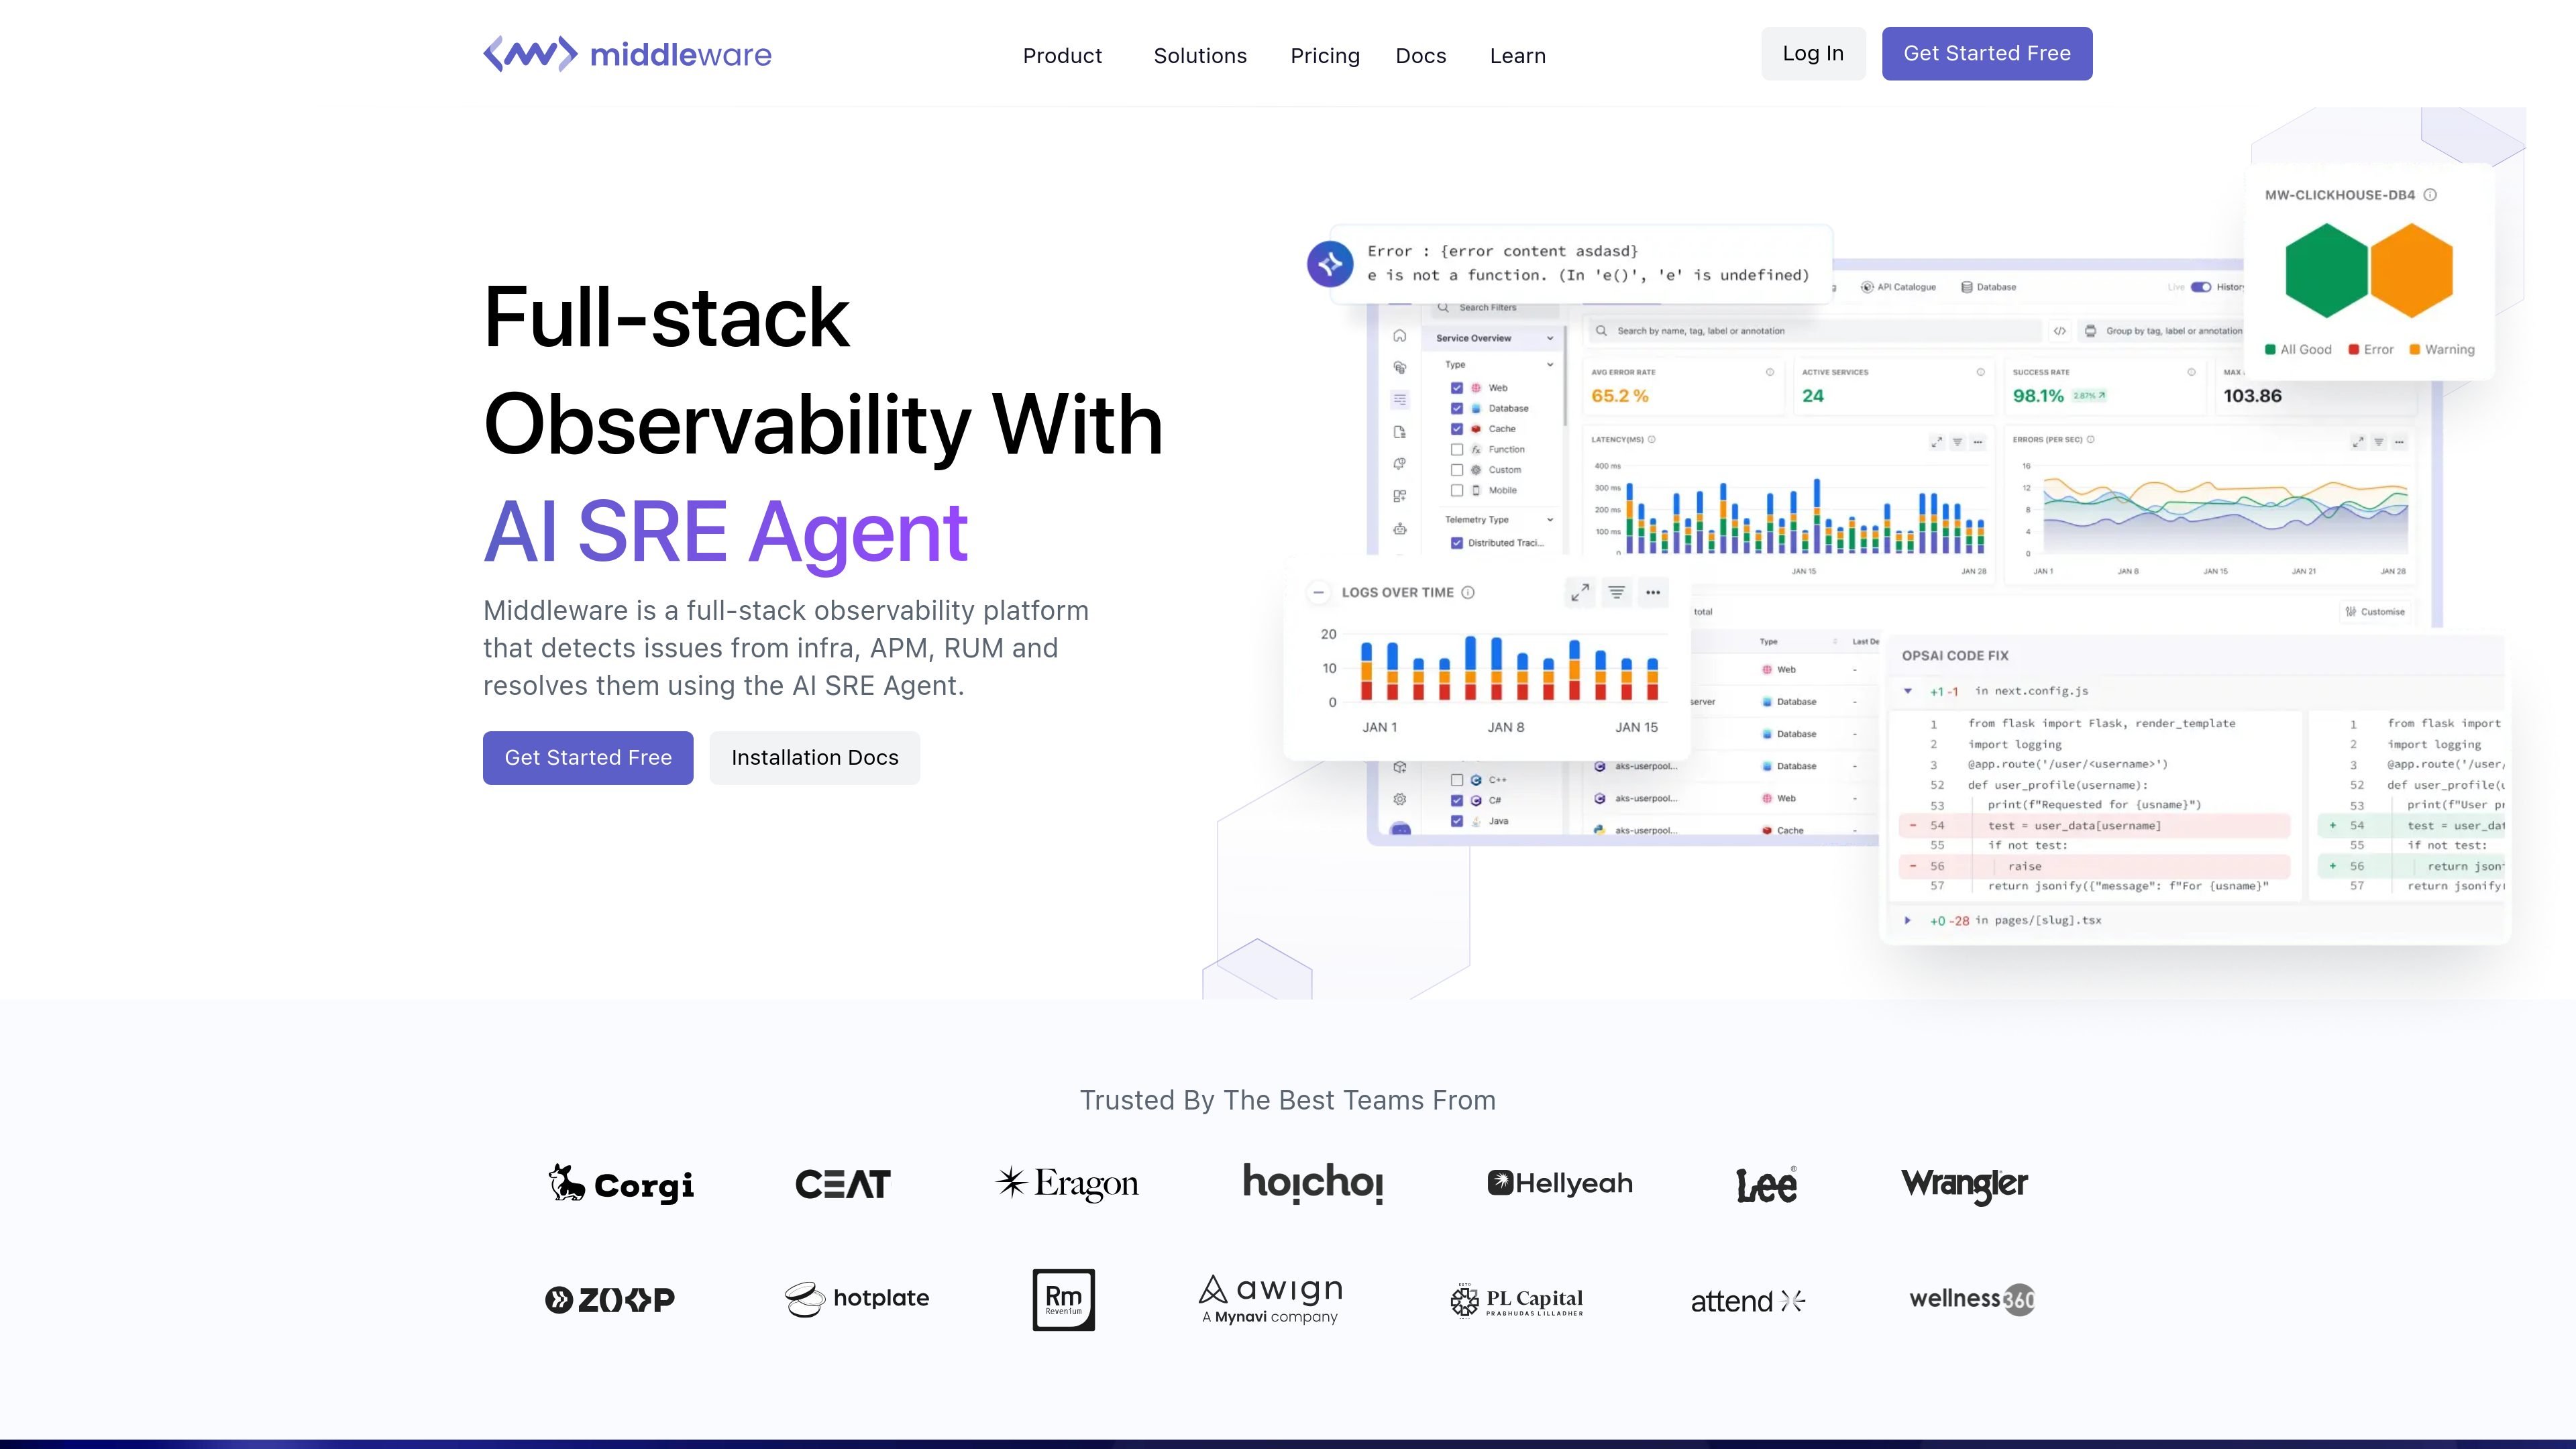
Unified telemetry view
Collect logs, metrics, traces, and other telemetry in one place so teams can work from a single timeline instead of switching tools during incidents.

Full-stack observability for logs, metrics, traces, apps, infrastructure, and user experience, with OpsAI for AI-powered issue detection and remediation.
Middleware is a full-stack observability platform built to help teams monitor applications, infrastructure, databases, containers, logs, real user activity, synthetic checks, browser journeys, and LLM-powered workflows from one place. The product positions OpsAI, its AI SRE agent, as a layer that can detect issues, trace them across signals, and help resolve them automatically.
The platform emphasizes unified telemetry and correlation rather than isolated tools. Its site describes a single timeline for logs, metrics, traces, and frontend sessions, OpenTelemetry support, natural-language exploration for dashboards and queries, and a lightweight installation flow with manual or auto instrumentation. Pricing is offered through a 14-day free trial, pay-as-you-go usage, and custom enterprise contracts.
Collect logs, metrics, traces, and other telemetry in one place so teams can work from a single timeline instead of switching tools during incidents.
Detect and investigate issues across applications, infrastructure, databases, containers, RUM, synthetics, browser tests, and LLM workflows from the same platform.
Use the AI SRE agent to identify anomalies, correlate signals, pinpoint root causes, and suggest or generate fixes, including opening pull requests in some workflows.
Run log, trace, and metric correlation along with natural-language query generation to help users inspect data without learning a custom query language.
Route, transform, and manage observability data through an observability pipeline with ingestion control, filtering, and retention options.
Connect Middleware to a large stack of tools through built-in integrations, including application, cloud, container, database, networking, notification, streaming, and telemetry systems.
Use Middleware to monitor production applications and infrastructure together so operations teams can spot incidents, correlate telemetry, and investigate root causes from a single workflow.
Track user-facing performance across web and mobile experiences with RUM, browser testing, and synthetic checks to catch issues before they affect customers.
Watch Kubernetes, containers, and cloud infrastructure alongside logs and traces to understand cluster health and the application impact of resource bottlenecks.
Analyze database performance across supported engines, identify slow queries, and relate database behavior to broader system issues during troubleshooting.
Support AI-powered applications by observing prompts, latency, token usage, costs, and backend traces in one place.
Middleware offers a 14-day free trial with unlimited data ingestion. Its paid options include pay-as-you-go and custom enterprise pricing.
The platform is described as a full-stack observability system with an AI SRE agent. It covers logs, metrics, traces, infrastructure, APM, RUM, synthetics, browser testing, databases, containers, and LLM monitoring.
The site says installation can be done with a lightweight agent and supports manual and auto instrumentation. It also states that Middleware supports OpenTelemetry and many other collectors and data sources.
Middleware says it unifies telemetry on a single timeline, correlates traces, logs, metrics, and frontend sessions by trace ID, and lets users ask for dashboards, charts, or queries in plain English prompts.
The source says pay-as-you-go customers can cancel anytime, and data is retained for 30 days after cancellation so it can be downloaded.
Traffic data is for reference only.

canyontechs.ai
CanyonTechs AI is an LLM-powered auto-remediation product that parses production logs, detects incidents, and delivers fixes as signed pull requests. It offers a workspace-based service with sign-up and login for individual and company users.

mezmo.com
AI-driven telemetry platform for filtering, routing, and analyzing logs, metrics, and traces
drdroid.io
AI SRE agent connecting tools for incident response and remediation
www.coldtea.ai
Coldtea is an AI-powered software delivery environment for teams that want to manage QA, production monitoring, bug detection, task creation, and fixes in one place. It runs on your machine to catch regressions and production issues after code is written.

rootly.com
AI-native incident management for engineering teams
coisland.app
CoIsland is a native macOS monitoring app that brings alerts from code, deploys, data tools, tickets, mail, and on-call services into the Mac's notch. Engineers can schedule tool-specific queries, review matching items, and hand an alert's context to Claude Code, Codex, or Cortex Code while retaining approval control.