
Repository-to-diagram conversion
Convert a GitHub repository into an interactive diagram for visual inspection. The homepage frames this as the core workflow for understanding repository structure.

GitDiagram turns GitHub repositories into interactive diagrams for visualization, with a public catalog to browse previously generated diagrams.
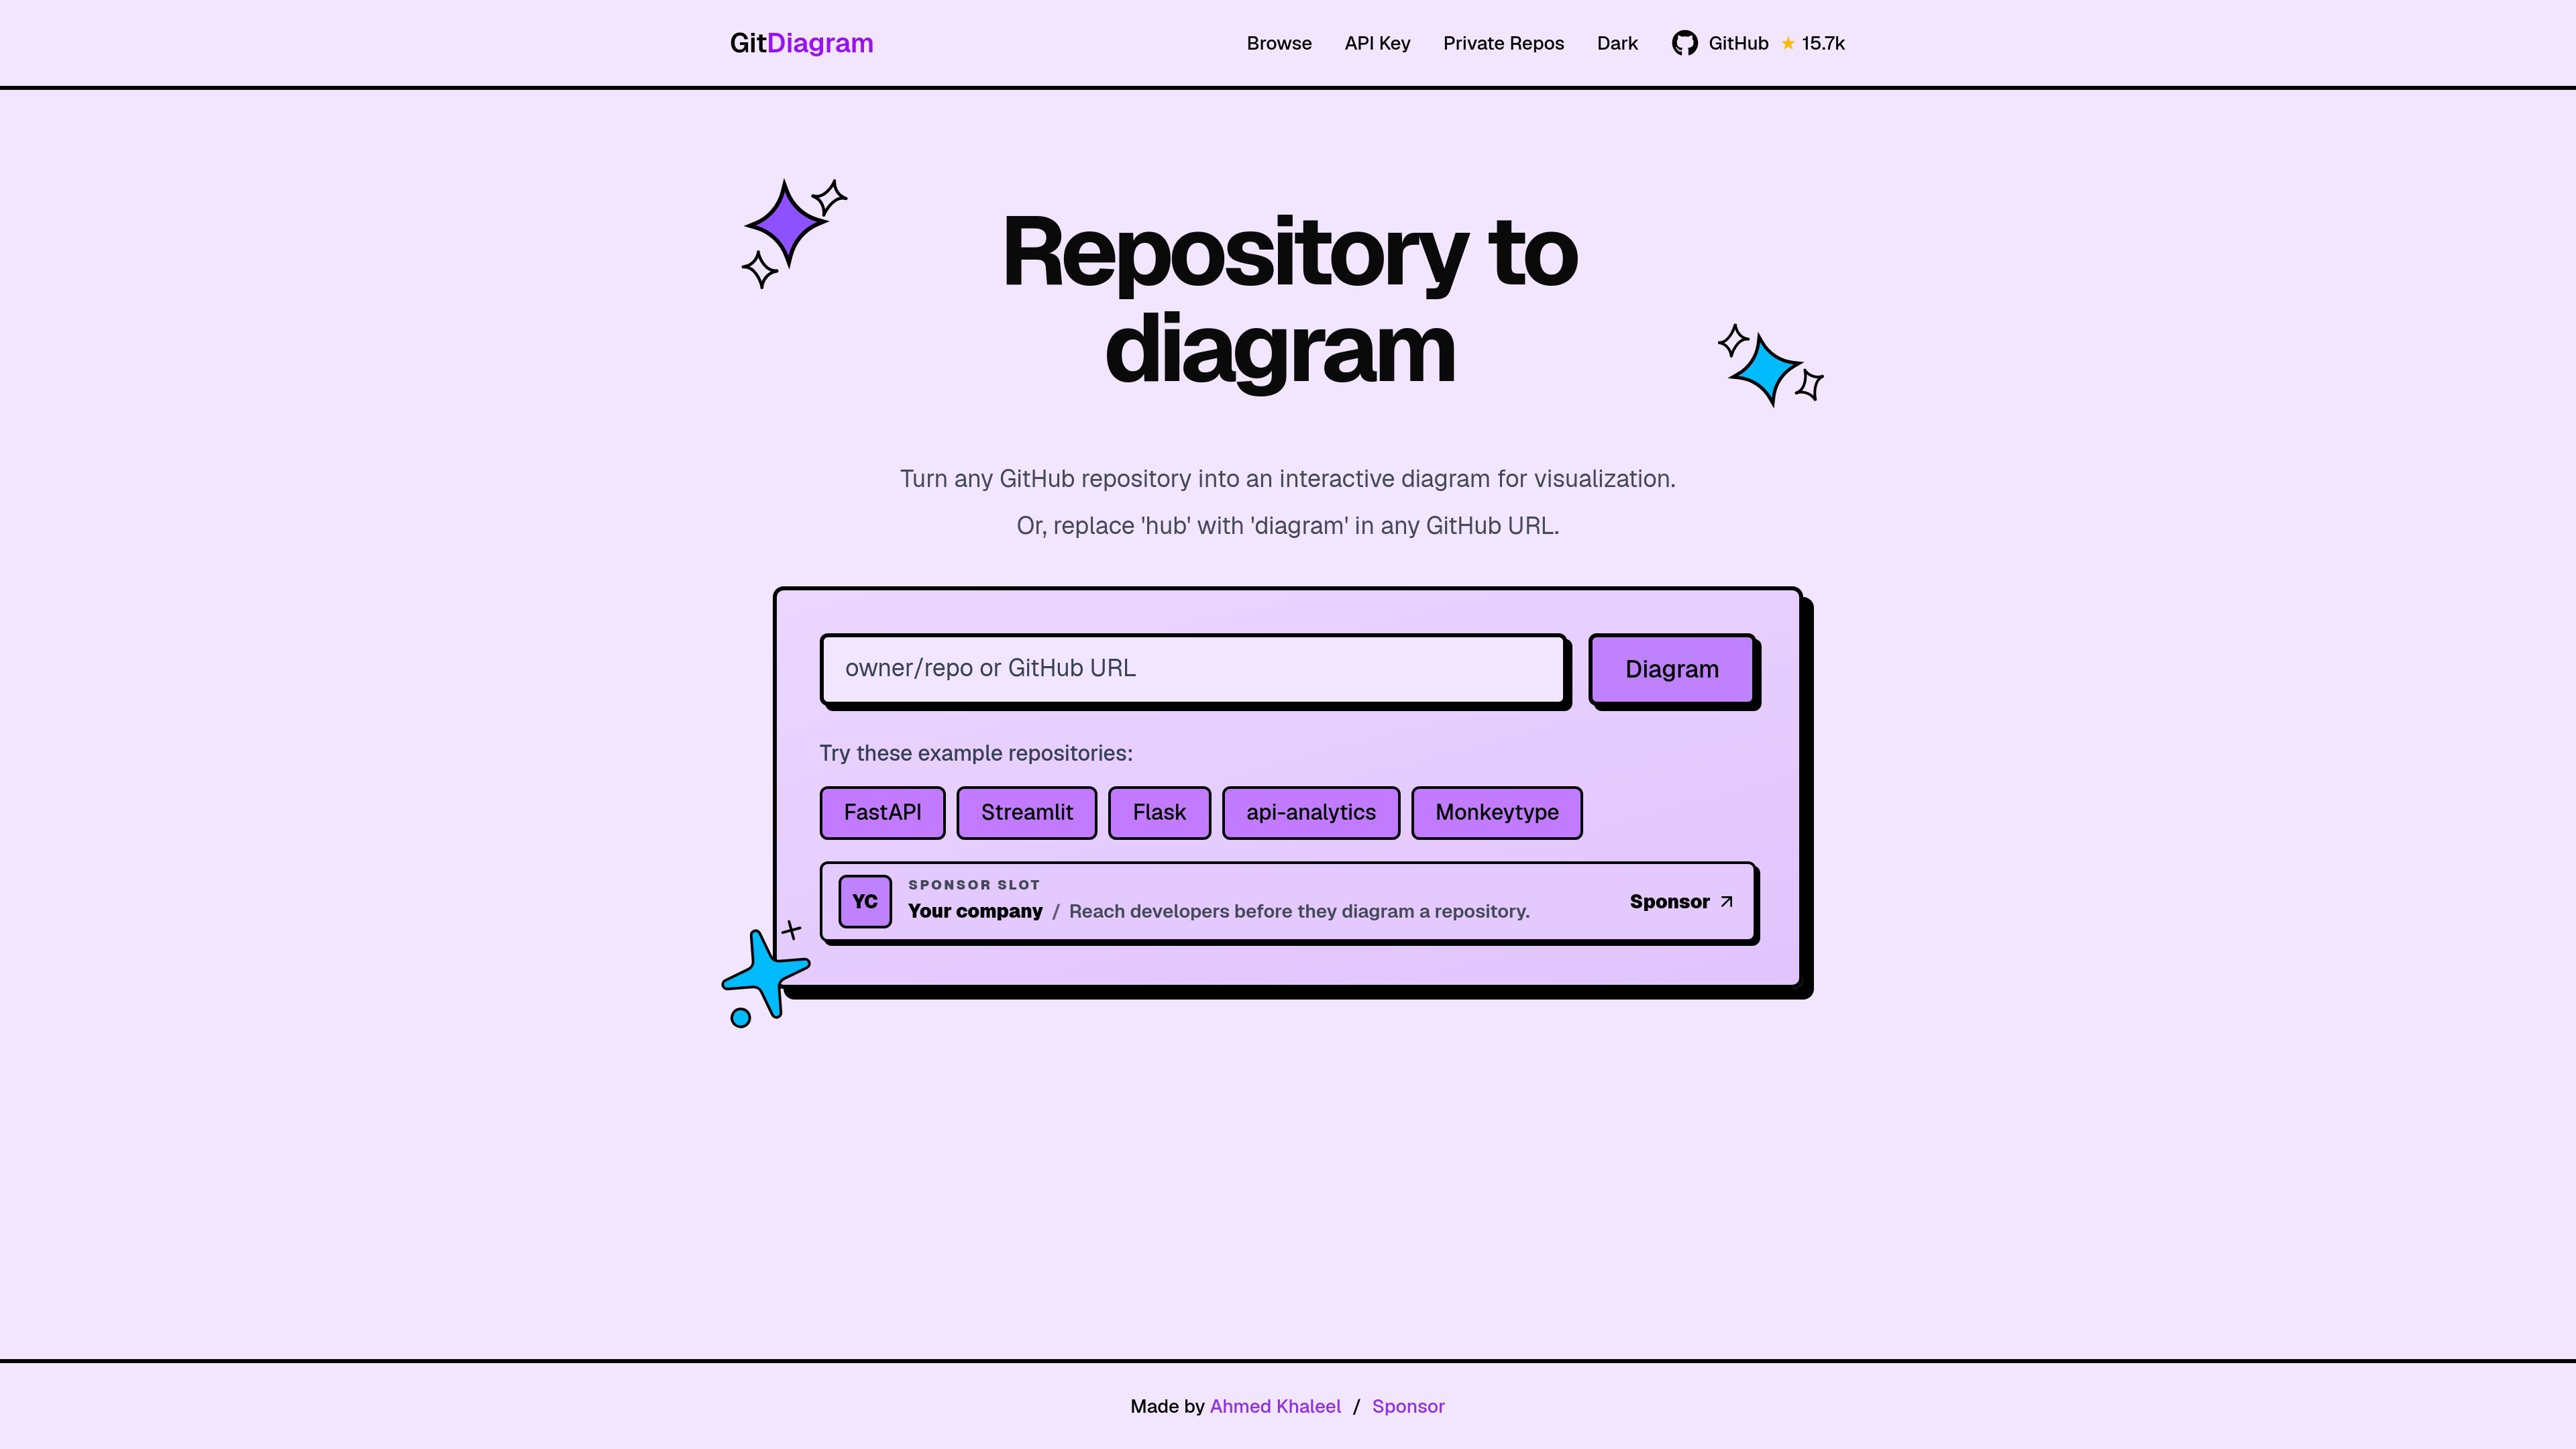
GitDiagram is a developer tool that turns a GitHub repository into an interactive diagram for visualization. Its homepage describes a simple workflow: enter a repository, or replace "hub" with "diagram" in a GitHub URL, to generate a diagram view of the codebase.
The product also includes a public browse page for stored repository diagrams, where visitors can search by repository name, star count, and generation time. That makes the site useful both as a direct repository viewer and as a catalog of previously generated diagrams.
Convert a GitHub repository into an interactive diagram for visual inspection. The homepage frames this as the core workflow for understanding repository structure.
Use the URL pattern described on the homepage by replacing "hub" with "diagram" in a GitHub URL to reach the diagram experience directly.
Start from example repositories shown on the homepage, including FastAPI, Streamlit, Flask, api-analytics, Monkeytype, and YC.
Browse stored public repository diagrams by repository name, star count, and generation time through the catalog page.
Open diagrams from catalog results to inspect generated repository views. The browse page presents each entry with repository name, stars, and last generated time.
Use GitDiagram when you need a fast visual map of a GitHub repository to understand modules and structure before reading code in depth.
Browse the public catalog to discover how different open-source projects are diagrammed and compare repository shapes across examples.
Share a diagram view with teammates or collaborators who need a quick architectural overview of a repository.
Use the example repositories on the homepage as a starting point when evaluating whether the product fits your workflow.
Use the browse page to find diagrams by popularity or recency when you want to review recently generated public repository views.
GitDiagram turns a GitHub repository into an interactive diagram. The site also indicates you can replace "hub" with "diagram" in a GitHub URL to reach a diagram view.
The source text shows a public browse view for stored repository diagrams, so the product supports viewing and searching generated diagrams from public repositories.
The pricing page text references an API key and private repos, but the rendered page content is incomplete and does not provide enough detail to confirm how those work.
The page shows example repositories and a public catalog of diagrams. It does not describe upload limits, team features, or other plan details in the source provided.
GitDiagram is presented as an open-source tool, and the sponsor page points to the project README and a project view. The provided source does not document a separate team workflow or account setup process.