
Native import and parsing
Import local files or SFTP data directly into a project, with delimiter, header row, skipped rows, and encoding controls. The app also shows a live preview before committing parsed data.

Autoplot is a native Mac scientific plotting and analysis app for turning tabular data into plots, fits, and reusable outputs with local workflows and publication-ready exports.
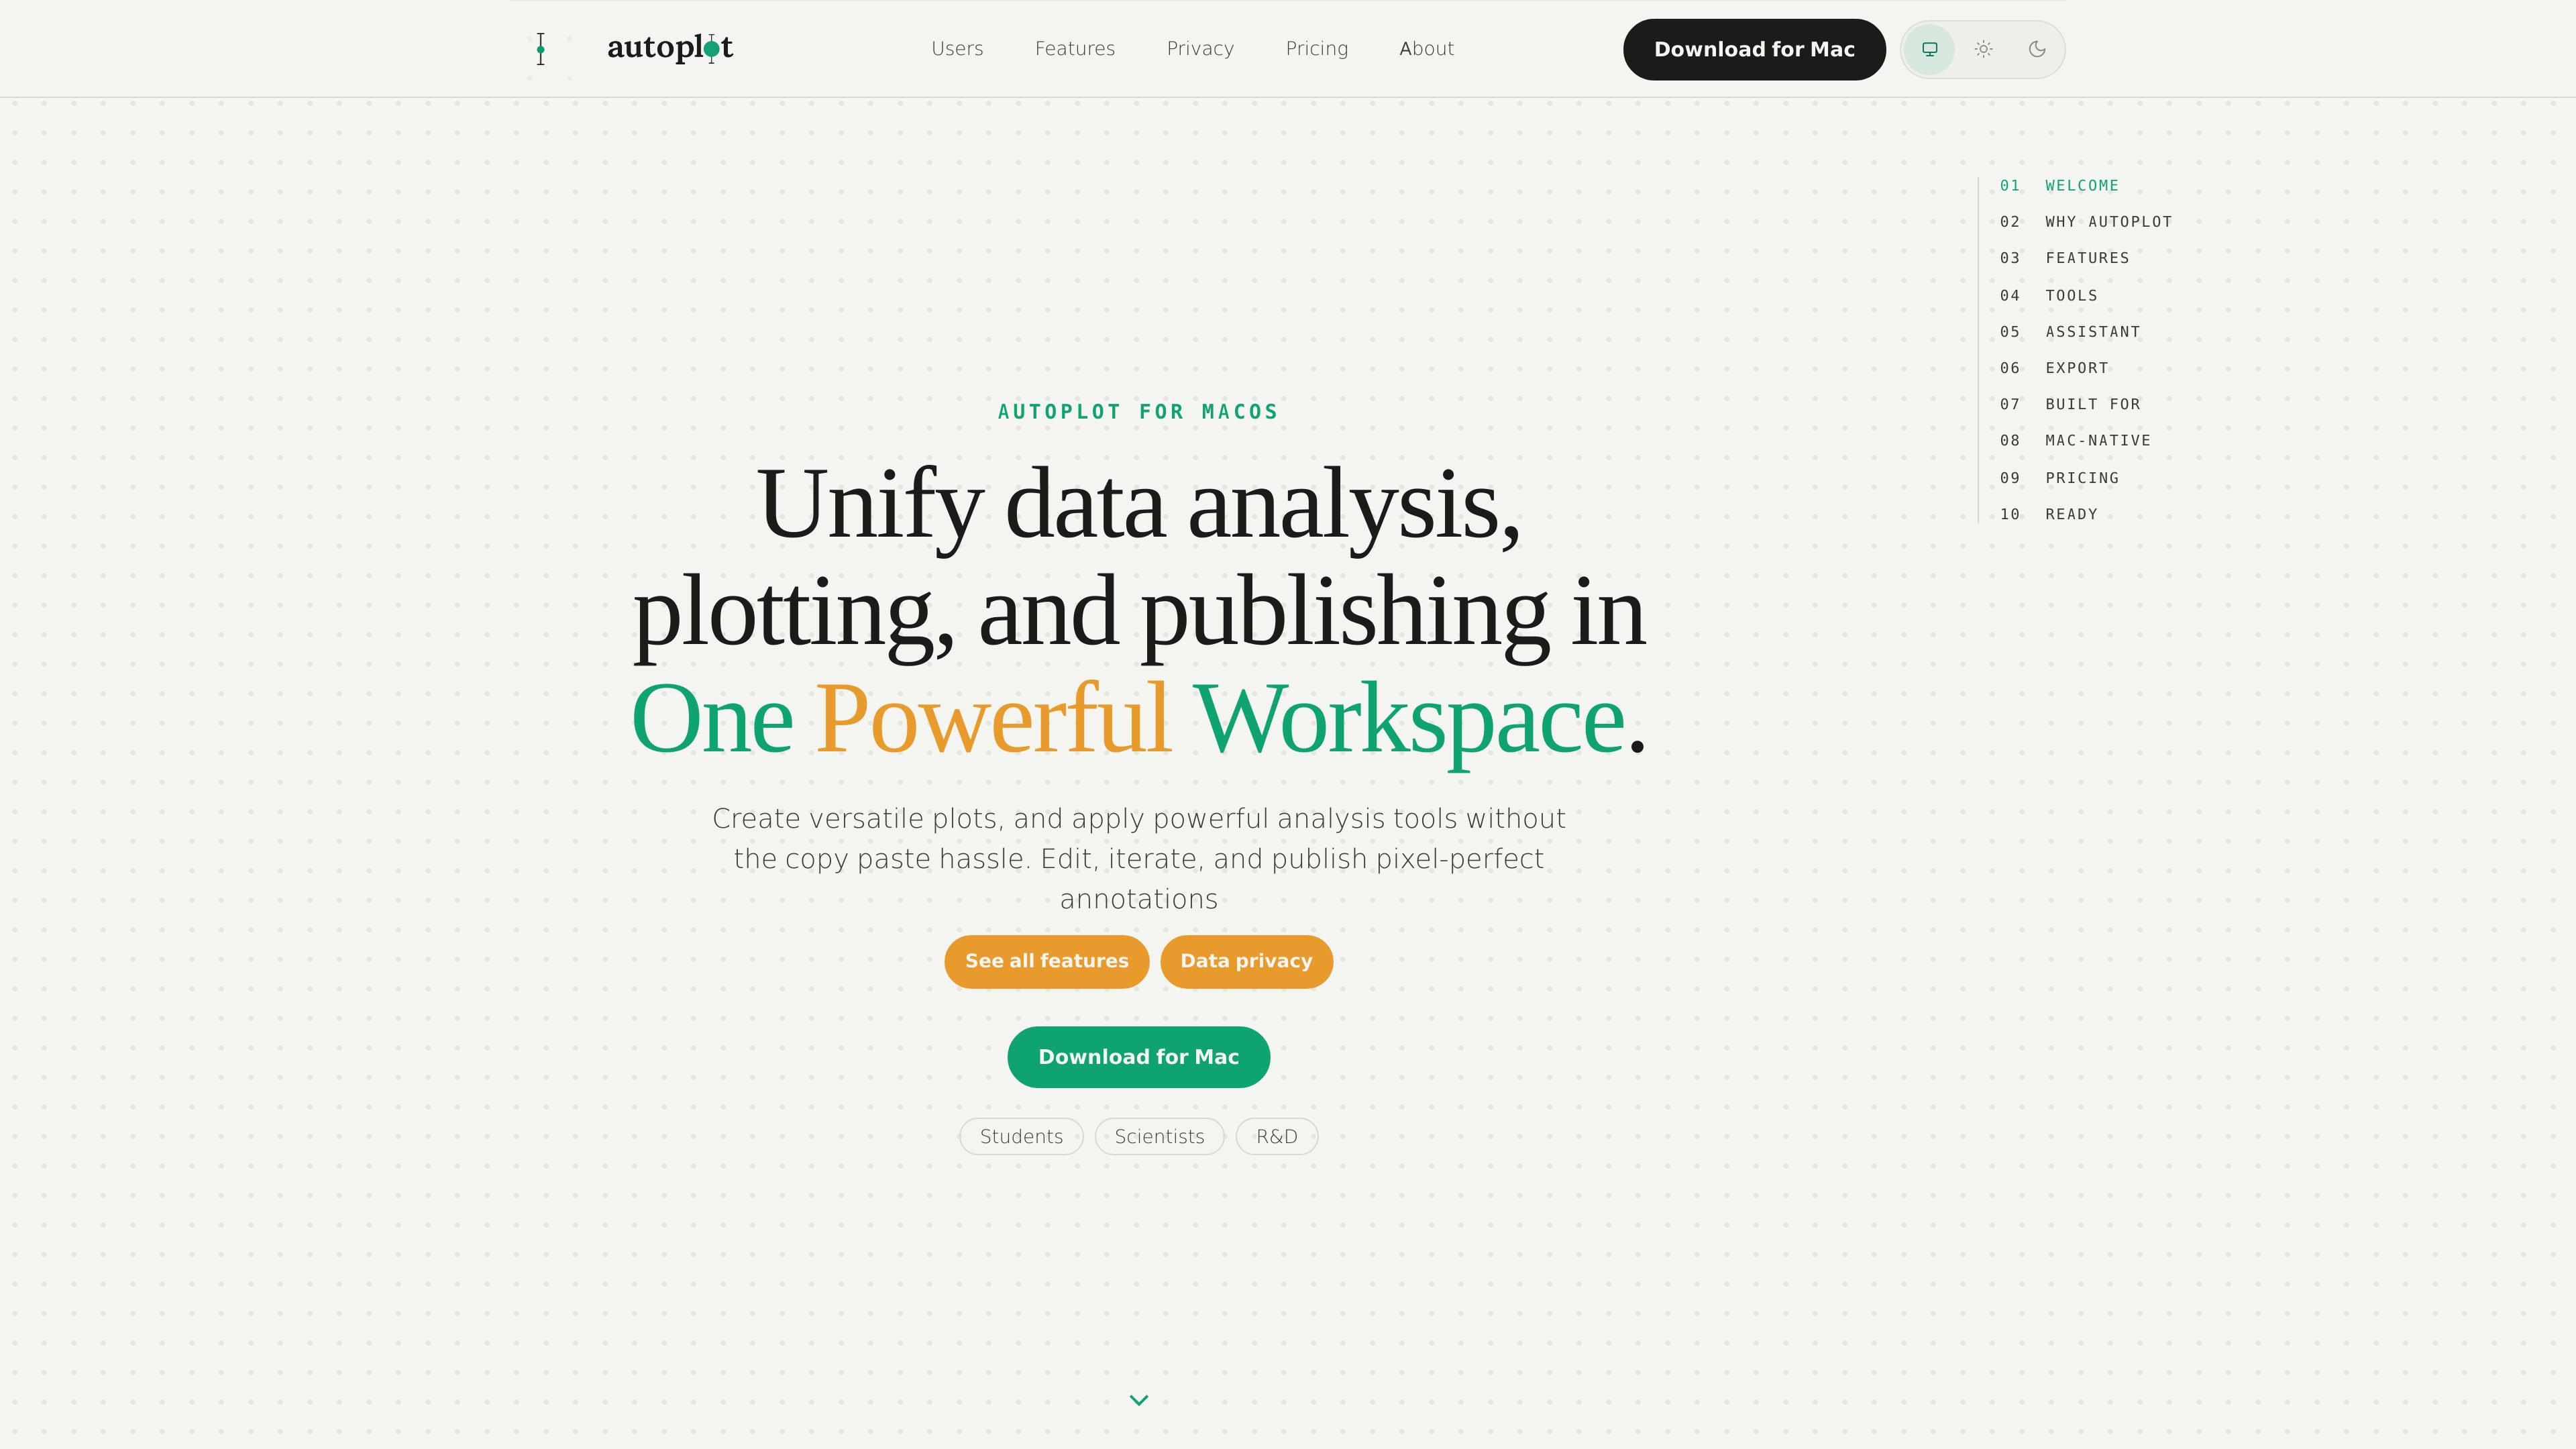
Autoplot is a native Mac scientific plotting and analysis workspace for turning tabular data into plots, fits, heat maps, and reusable analysis outputs. It is built to keep importing, cleaning, plotting, annotation, and export in one place instead of moving between a chatbot, terminal, and image editor.
The product emphasizes local workflows on macOS and Apple Silicon. The pages describe direct file import, assistant-guided Python that runs locally, reusable outputs, and export formats aimed at publication figures, including vector PDF with embedded fonts and PNG/JPG presets.
Import local files or SFTP data directly into a project, with delimiter, header row, skipped rows, and encoding controls. The app also shows a live preview before committing parsed data.
Merge multiple files, trim rows, splice variables, derive new values, and clean or impute data with assistant-written Python that you review before it runs locally.
Build X&Y plots, histograms, heat maps, 3D scatter plots, 3D surface plots, 3D line plots, categorical charts, and correlation views in one workspace.
Run pre-vetted analysis cards for log-binned distributions, power-law and truncated fits, CDF/CCDF, x_min diagnostics, finite-size scaling collapse, E–S scaling, and AUC.
Overlay multiple series, fits, contours, annotations, labels, and legends on a figure, with elements that survive restyles and re-runs.
Export a single figure or a composed board as vector PDF with embedded fonts, or as PNG and JPG at journal sizes and DPI presets; also export the analysis as runnable Python and Matplotlib.
Import CSV, TSV, or other delimited lab data, clean up headers or merges, make a fit, and export a publication-ready PDF without moving through multiple tools.
Run built-in analysis cards for distributions, tail behavior, and scaling, then reuse the resulting variables to adjust the plot or generate a new figure with the same data.
Create multi-panel boards, add annotations and legends that stay attached to the figure, and export a single composed output for a paper or report.
Use the local toolkit on sensitive datasets where the raw values should stay on the Mac, while still allowing optional assistant help for schema-aware requests.
Compare series, correlations, and network structure across multiple variables to screen for relationships before building a more formal model.
Yes. The page says the local toolkit works without an internet connection; only the hosted assistant, account, waitlist, and billing paths need network access.
The Free tier is permanent, not a trial. It includes X&Y plots, histograms with fits, PDF/log-binned/power-law analysis, vector PDF export, project save/load, and 10 hosted-AI credits per month.
Plus unlocks the analysis surfaces and more specialized plots that are not included in Free, while Pro includes Plus and increases the hosted-AI cap to 1000 credits per month.
The assistant is optional. The source says disabling it does not remove the non-AI toolkit.
The source says raw data never reaches the AI layer. The assistant sees your intent and dataset schema, not the values.