
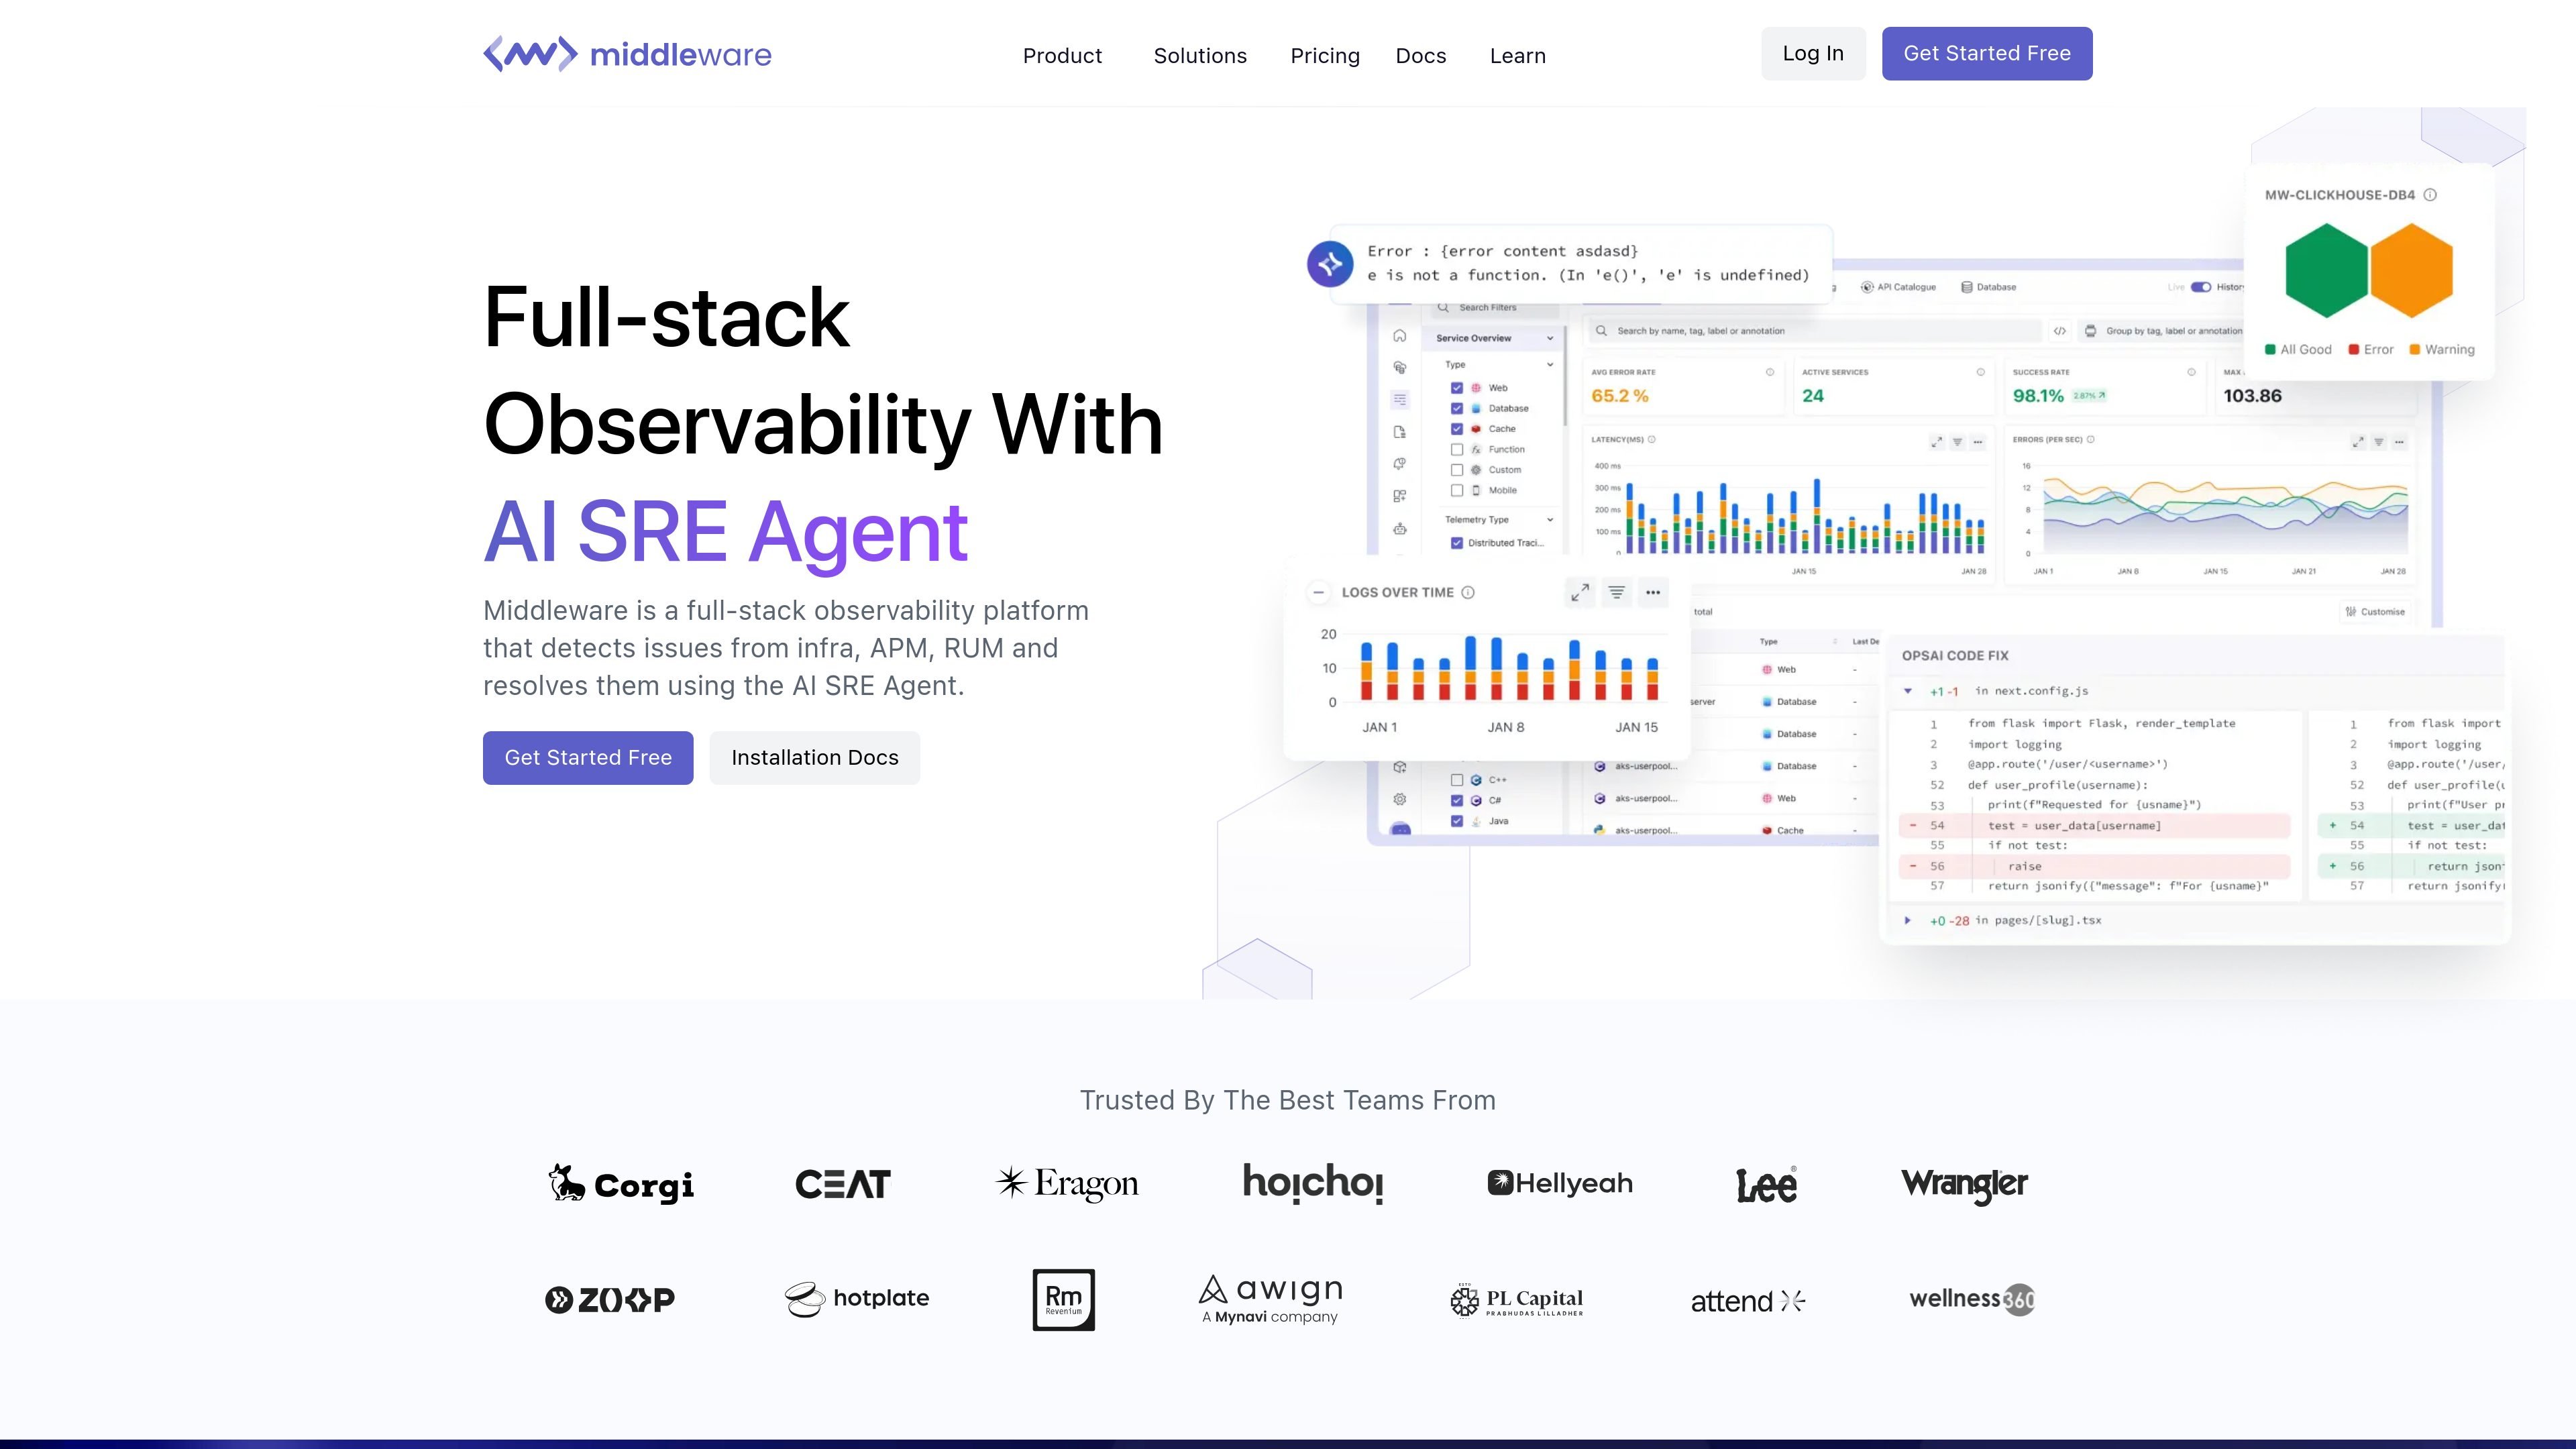
Unified telemetry view
Collect logs, metrics, traces, and other telemetry in one place so teams can work from a single timeline instead of switching tools during incidents.

Observabilité full-stack des logs, métriques, traces, infrastructures, applications et expérience utilisateur, avec OpsAI pour détecter les problèmes et faciliter leur résolution.
Middleware is a full-stack observability platform built to help teams monitor applications, infrastructure, databases, containers, logs, real user activity, synthetic checks, browser journeys, and LLM-powered workflows from one place. The product positions OpsAI, its AI SRE agent, as a layer that can detect issues, trace them across signals, and help resolve them automatically.
The platform emphasizes unified telemetry and correlation rather than isolated tools. Its site describes a single timeline for logs, metrics, traces, and frontend sessions, OpenTelemetry support, natural-language exploration for dashboards and queries, and a lightweight installation flow with manual or auto instrumentation. Pricing is offered through a 14-day free trial, pay-as-you-go usage, and custom enterprise contracts.
Collect logs, metrics, traces, and other telemetry in one place so teams can work from a single timeline instead of switching tools during incidents.
Detect and investigate issues across applications, infrastructure, databases, containers, RUM, synthetics, browser tests, and LLM workflows from the same platform.
Use the AI SRE agent to identify anomalies, correlate signals, pinpoint root causes, and suggest or generate fixes, including opening pull requests in some workflows.
Run log, trace, and metric correlation along with natural-language query generation to help users inspect data without learning a custom query language.
Route, transform, and manage observability data through an observability pipeline with ingestion control, filtering, and retention options.
Connect Middleware to a large stack of tools through built-in integrations, including application, cloud, container, database, networking, notification, streaming, and telemetry systems.
Use Middleware to monitor production applications and infrastructure together so operations teams can spot incidents, correlate telemetry, and investigate root causes from a single workflow.
Track user-facing performance across web and mobile experiences with RUM, browser testing, and synthetic checks to catch issues before they affect customers.
Watch Kubernetes, containers, and cloud infrastructure alongside logs and traces to understand cluster health and the application impact of resource bottlenecks.
Analyze database performance across supported engines, identify slow queries, and relate database behavior to broader system issues during troubleshooting.
Support AI-powered applications by observing prompts, latency, token usage, costs, and backend traces in one place.
Middleware offers a 14-day free trial with unlimited data ingestion. Its paid options include pay-as-you-go and custom enterprise pricing.
The platform is described as a full-stack observability system with an AI SRE agent. It covers logs, metrics, traces, infrastructure, APM, RUM, synthetics, browser testing, databases, containers, and LLM monitoring.
The site says installation can be done with a lightweight agent and supports manual and auto instrumentation. It also states that Middleware supports OpenTelemetry and many other collectors and data sources.
Middleware says it unifies telemetry on a single timeline, correlates traces, logs, metrics, and frontend sessions by trace ID, and lets users ask for dashboards, charts, or queries in plain English prompts.
The source says pay-as-you-go customers can cancel anytime, and data is retained for 30 days after cancellation so it can be downloaded.
Les données de trafic sont fournies à titre indicatif uniquement.

metoro.io
Metoro helps Kubernetes teams monitor workloads and investigate production incidents by connecting logs, metrics, traces, profiles, and cluster state to alerts and deployment changes.
www.coldtea.ai
Coldtea est un environnement de livraison logicielle propulsé par l’IA pour les équipes qui souhaitent gérer au même endroit l’assurance qualité, la surveillance de la production, la détection des bugs, la création de tâches et les correctifs. Il s’exécute sur votre machine pour repérer les régressions et les problèmes de production après l’écriture du code.

trysoup.dev
Soup CLI est un outil en ligne de commande open source dédié au post-entraînement et aux workflows associés aux modèles : fine-tuning, entraînement par préférences, évaluation, fusion, déploiement et préparation des données. Il s’adresse aux personnes qui souhaitent gérer l’entraînement et la mise en production de modèles avec une seule CLI hors ligne, sur leur propre matériel ou du matériel emprunté.

nuphos.ai
Nuphos est un espace de travail DevOps natif de l’IA pour les équipes d’ingénierie. Il fournit un environnement partagé où les agents d’IA peuvent apprendre l’infrastructure, analyser les incidents et exploiter les systèmes de production avec approbation humaine et traçabilité des audits.