
Text-to-infographic input
Paste in a stat, outline, transcript, or rough sketch, and optionally add a brand reference. The product is positioned to turn plain source material into a finished infographic without opening design software first.
Masonry is an AI infographic generator that turns briefs, stats, outlines, transcripts, or sketches into polished visuals. It is aimed at marketing and content teams that need fast, on-brand infographics for decks, posts, reports, and internal communication.
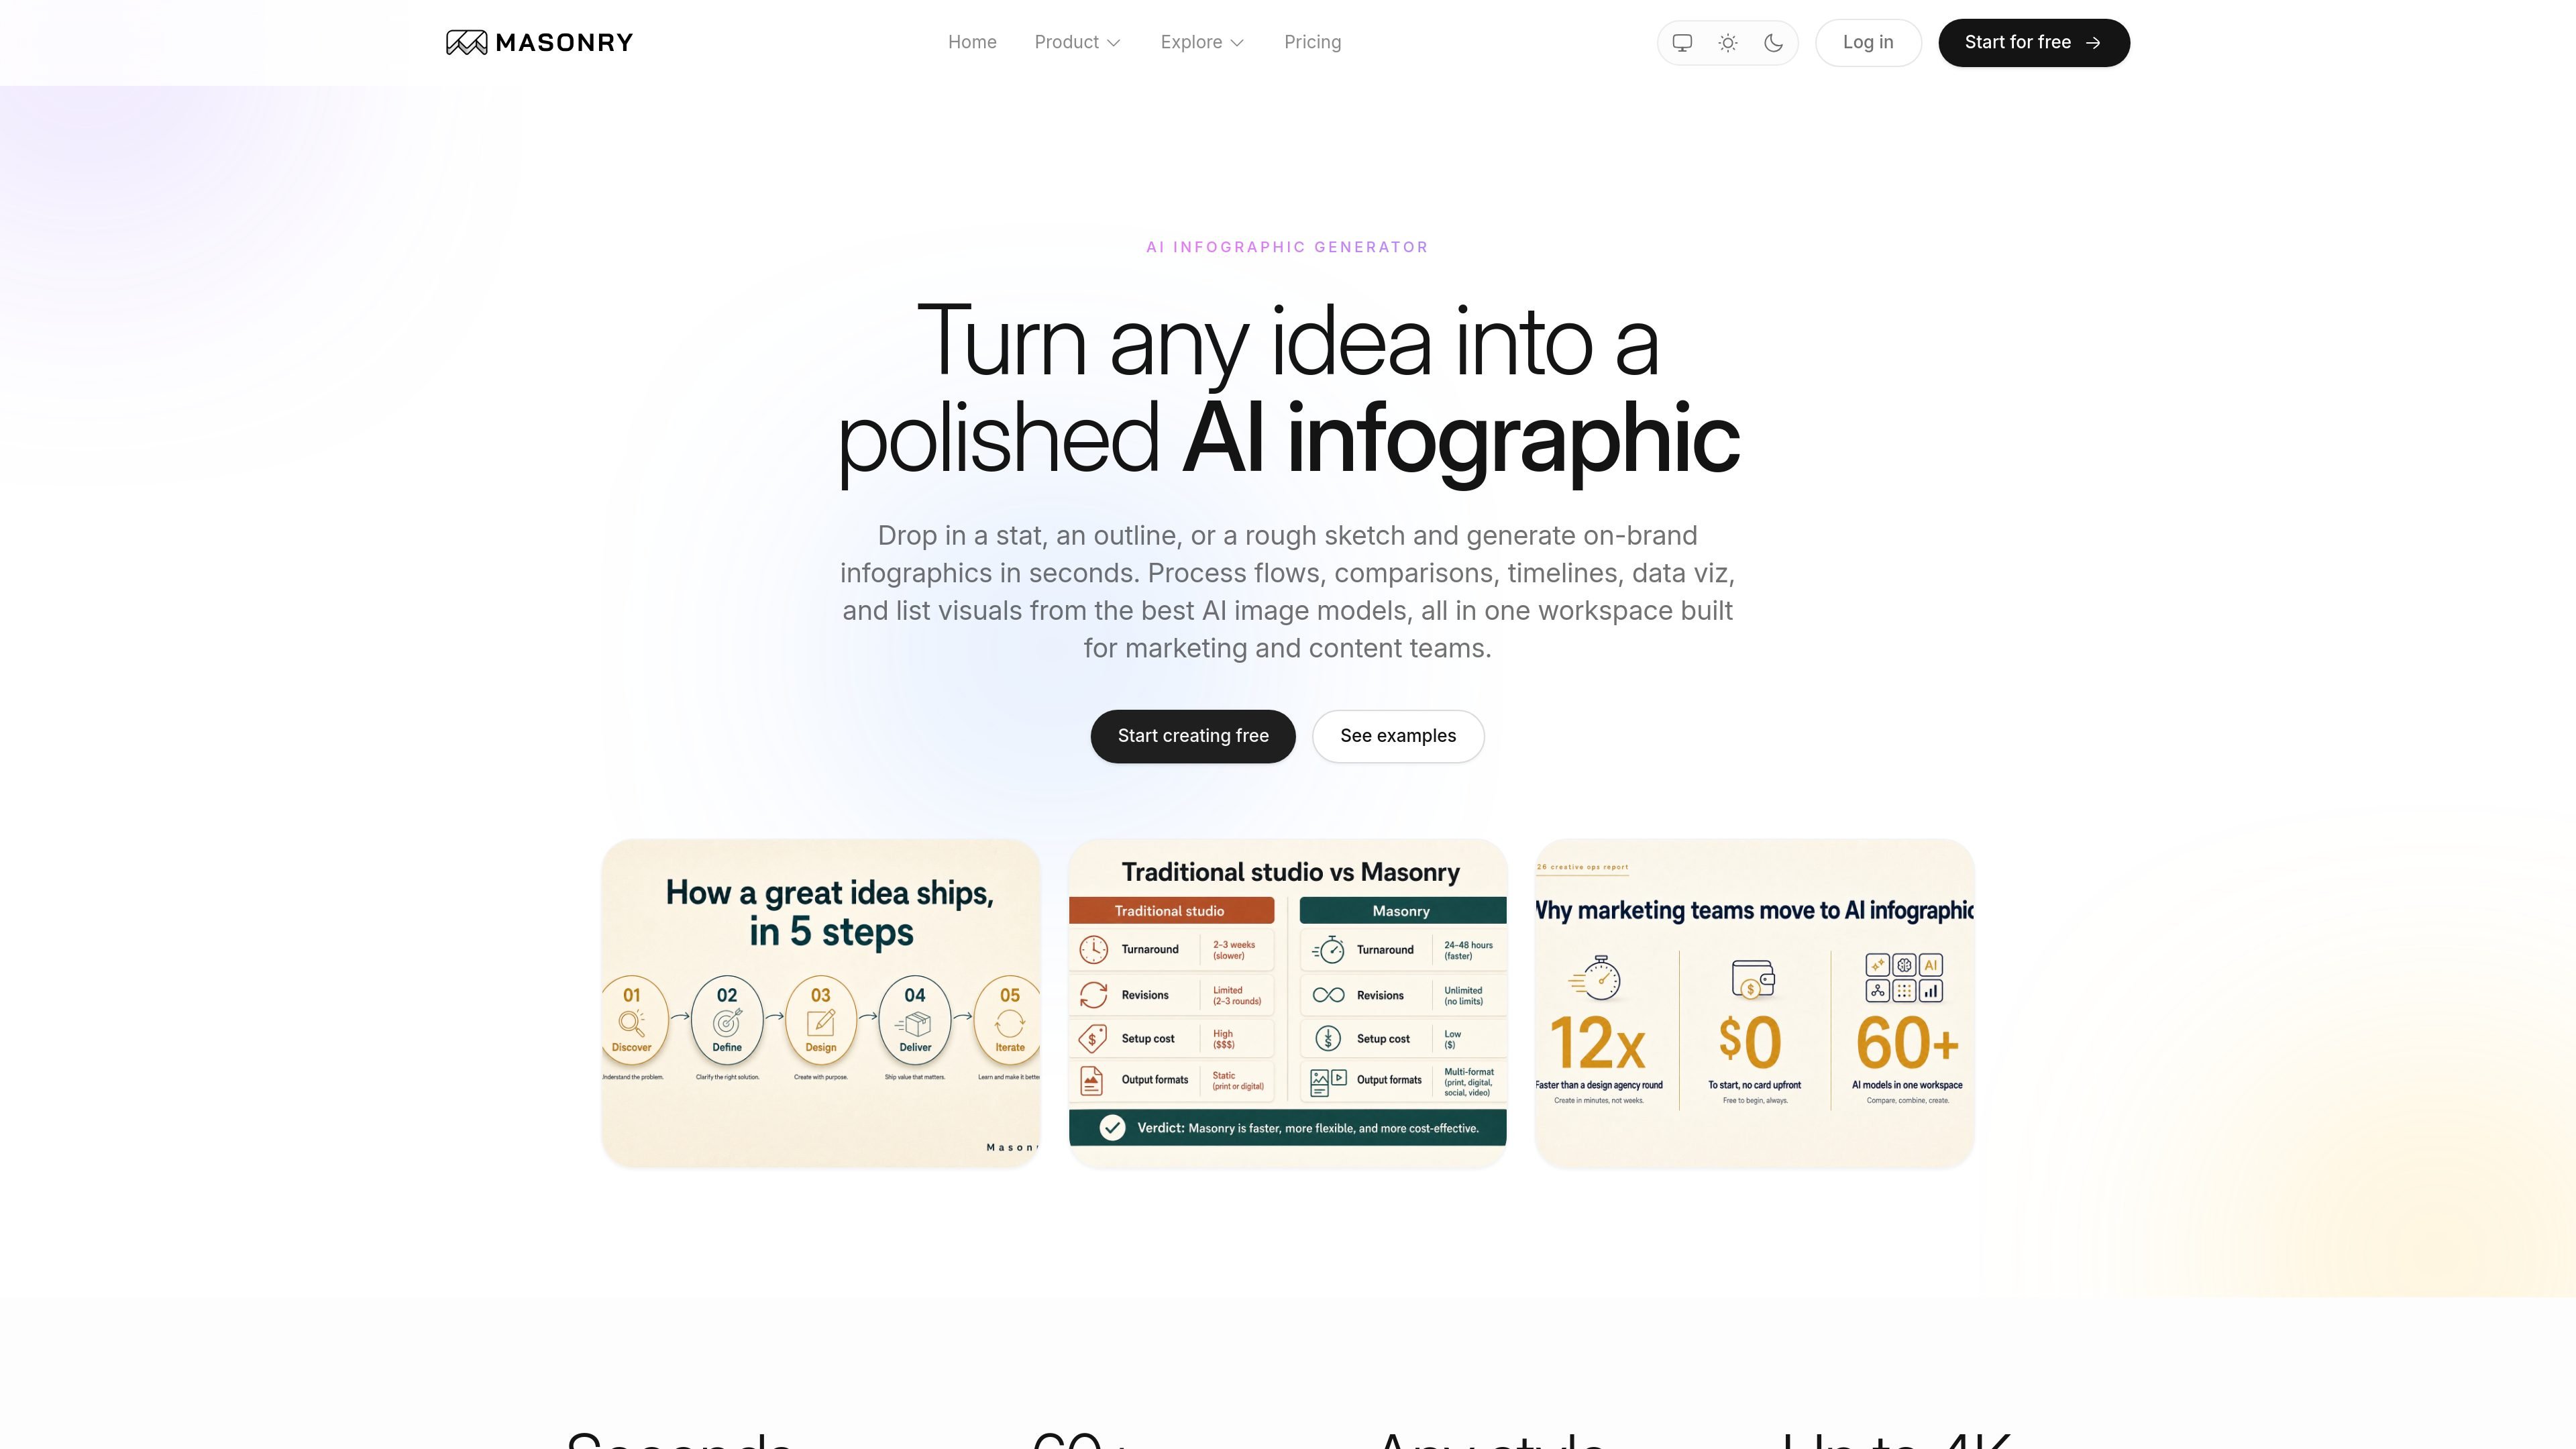
Masonry is an AI infographic generator that turns short inputs such as briefs, statistics, outlines, transcripts, or rough sketches into finished infographic visuals. The site positions it as a single workspace for generating, comparing, refining, and exporting on-brand graphics.
It is aimed at marketing and content teams that need process flows, comparisons, timelines, data visuals, and list-style infographics without moving between separate design tools. The product emphasizes editorial-looking output, multiple AI models, and high-resolution exports suitable for client decks and campaign assets.
Paste in a stat, outline, transcript, or rough sketch, and optionally add a brand reference. The product is positioned to turn plain source material into a finished infographic without opening design software first.
Choose from process flow, comparison, timeline, list, data-viz, and stat-strip formats, or work from a reference. This keeps the output aligned with the kind of visual story you need to tell.
Compare outputs from more than one AI model in the same workspace, then keep the strongest result. The site explicitly highlights Ideogram, Recraft, Nano Banana Pro, FLUX.2 Pro, Seedream 4.5, and GPT Image 2.
Swap palettes, tweak the prompt, and regenerate only the parts you want to change. The workflow is designed for iterative refinement rather than a single one-shot render.
Lock a palette or anchor on a reference image to keep visuals consistent across a campaign or set of assets. The product emphasizes on-brand output over generic template reuse.
Export high-resolution visuals for decks, campaigns, landing pages, blog posts, and printed handouts. The homepage also calls out up to 4K export resolution.
Turn a launch brief, positioning note, or product description into a slide-ready visual for a pitch, campaign deck, or one-pager.
Convert a stat, survey result, or benchmark into a stat strip, chart-led infographic, or comparison graphic for LinkedIn, Instagram, or a blog post.
Map a workflow, timeline, or milestone sequence into a clearer visual for a roadmap update, internal announcement, or stakeholder presentation.
Create visuals for reports and whitepapers that need editorial-looking figures instead of plain tables or dense paragraphs.
Generate org charts, decision trees, or onboarding diagrams that are easier for employees to scan than a text-heavy memo.
Yes. The site says Masonry can generate editorial-quality infographics from a stat, outline, transcript, rough sketch, or brand reference, and that the right models can render typography, labels, axis text, and callouts legibly.
The site lists process flows, comparisons, timelines, statistical strips, lists and checklists, data-viz charts, hierarchical diagrams, anatomy breakdowns, geographic visuals, and editorial spreads.
The homepage says you can get multiple concepts at once, compare them across models, refine the prompt or palette, and export in high resolution.
The site says visuals are high-resolution and licensed for commercial use, with no watermarks and no per-image fees mentioned on the homepage.
The source does not document a public API, team workspace, or integrations page, so those capabilities should be treated as unconfirmed from the current site pages.