
Gráficos IA
Productos
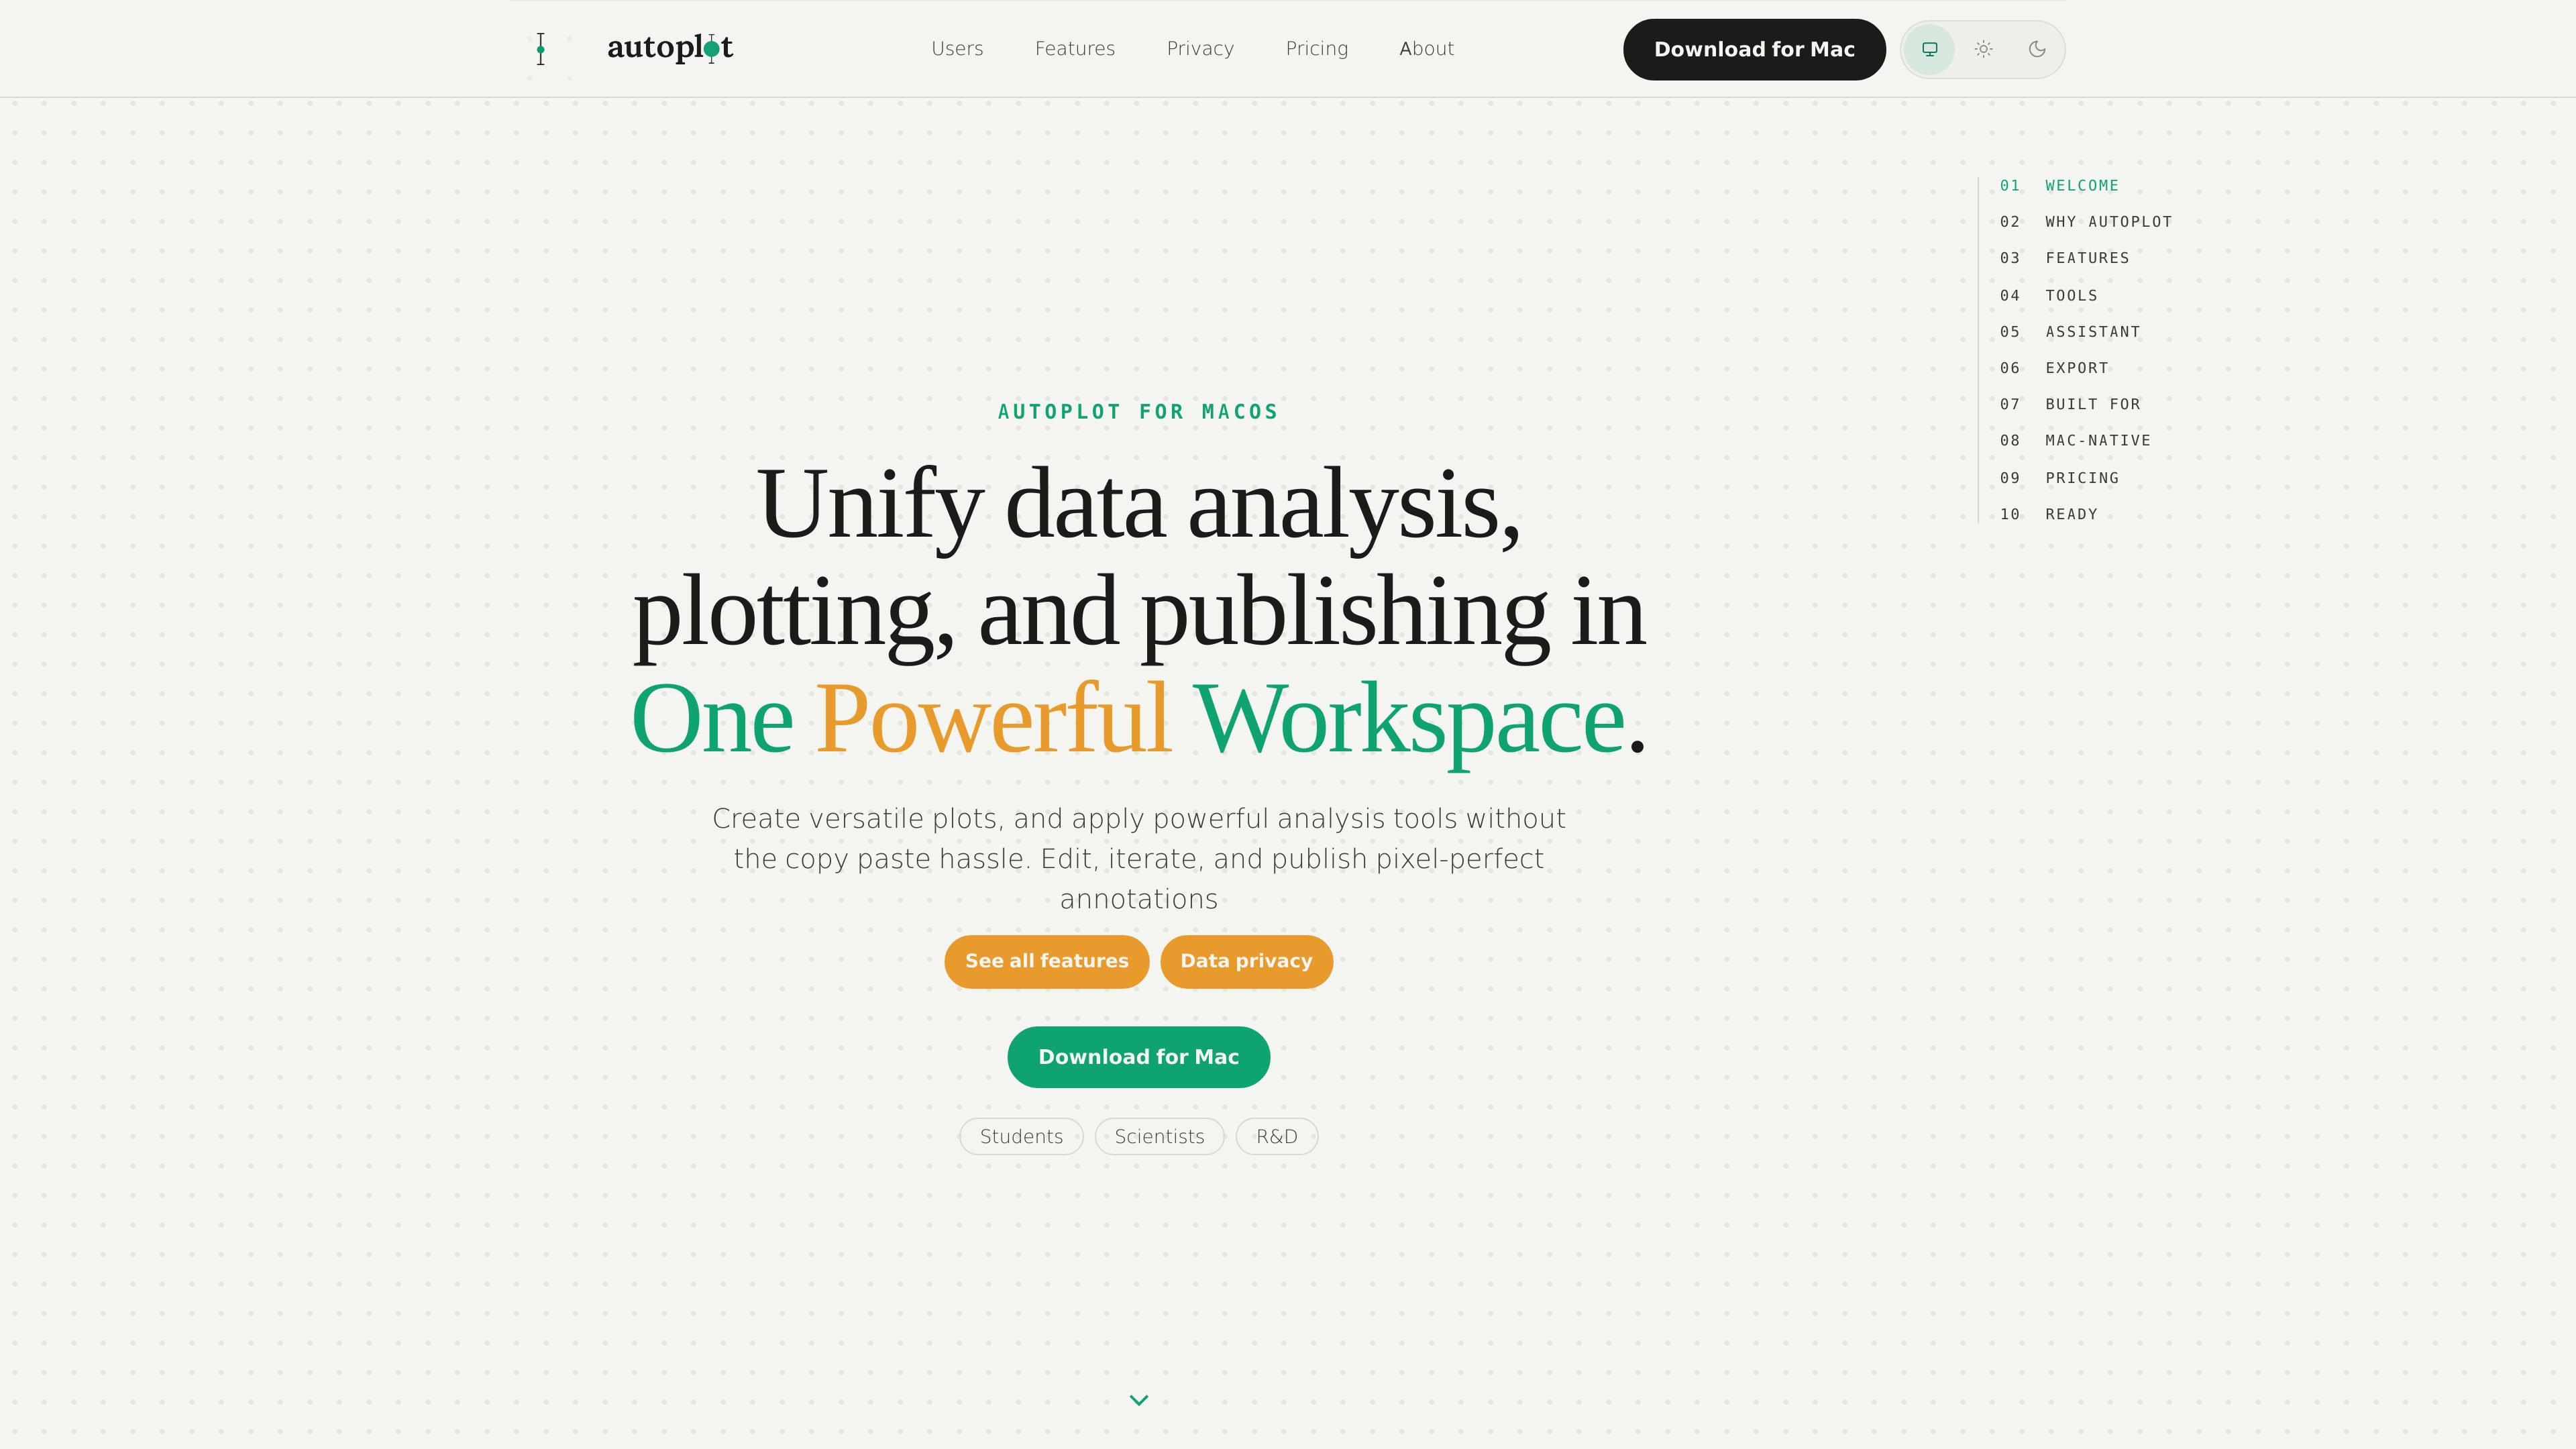

Autoplot is a native Mac scientific plotting and analysis app for turning tabular data into plots, fits, and reusable outputs with local workflows and publication-ready exports.
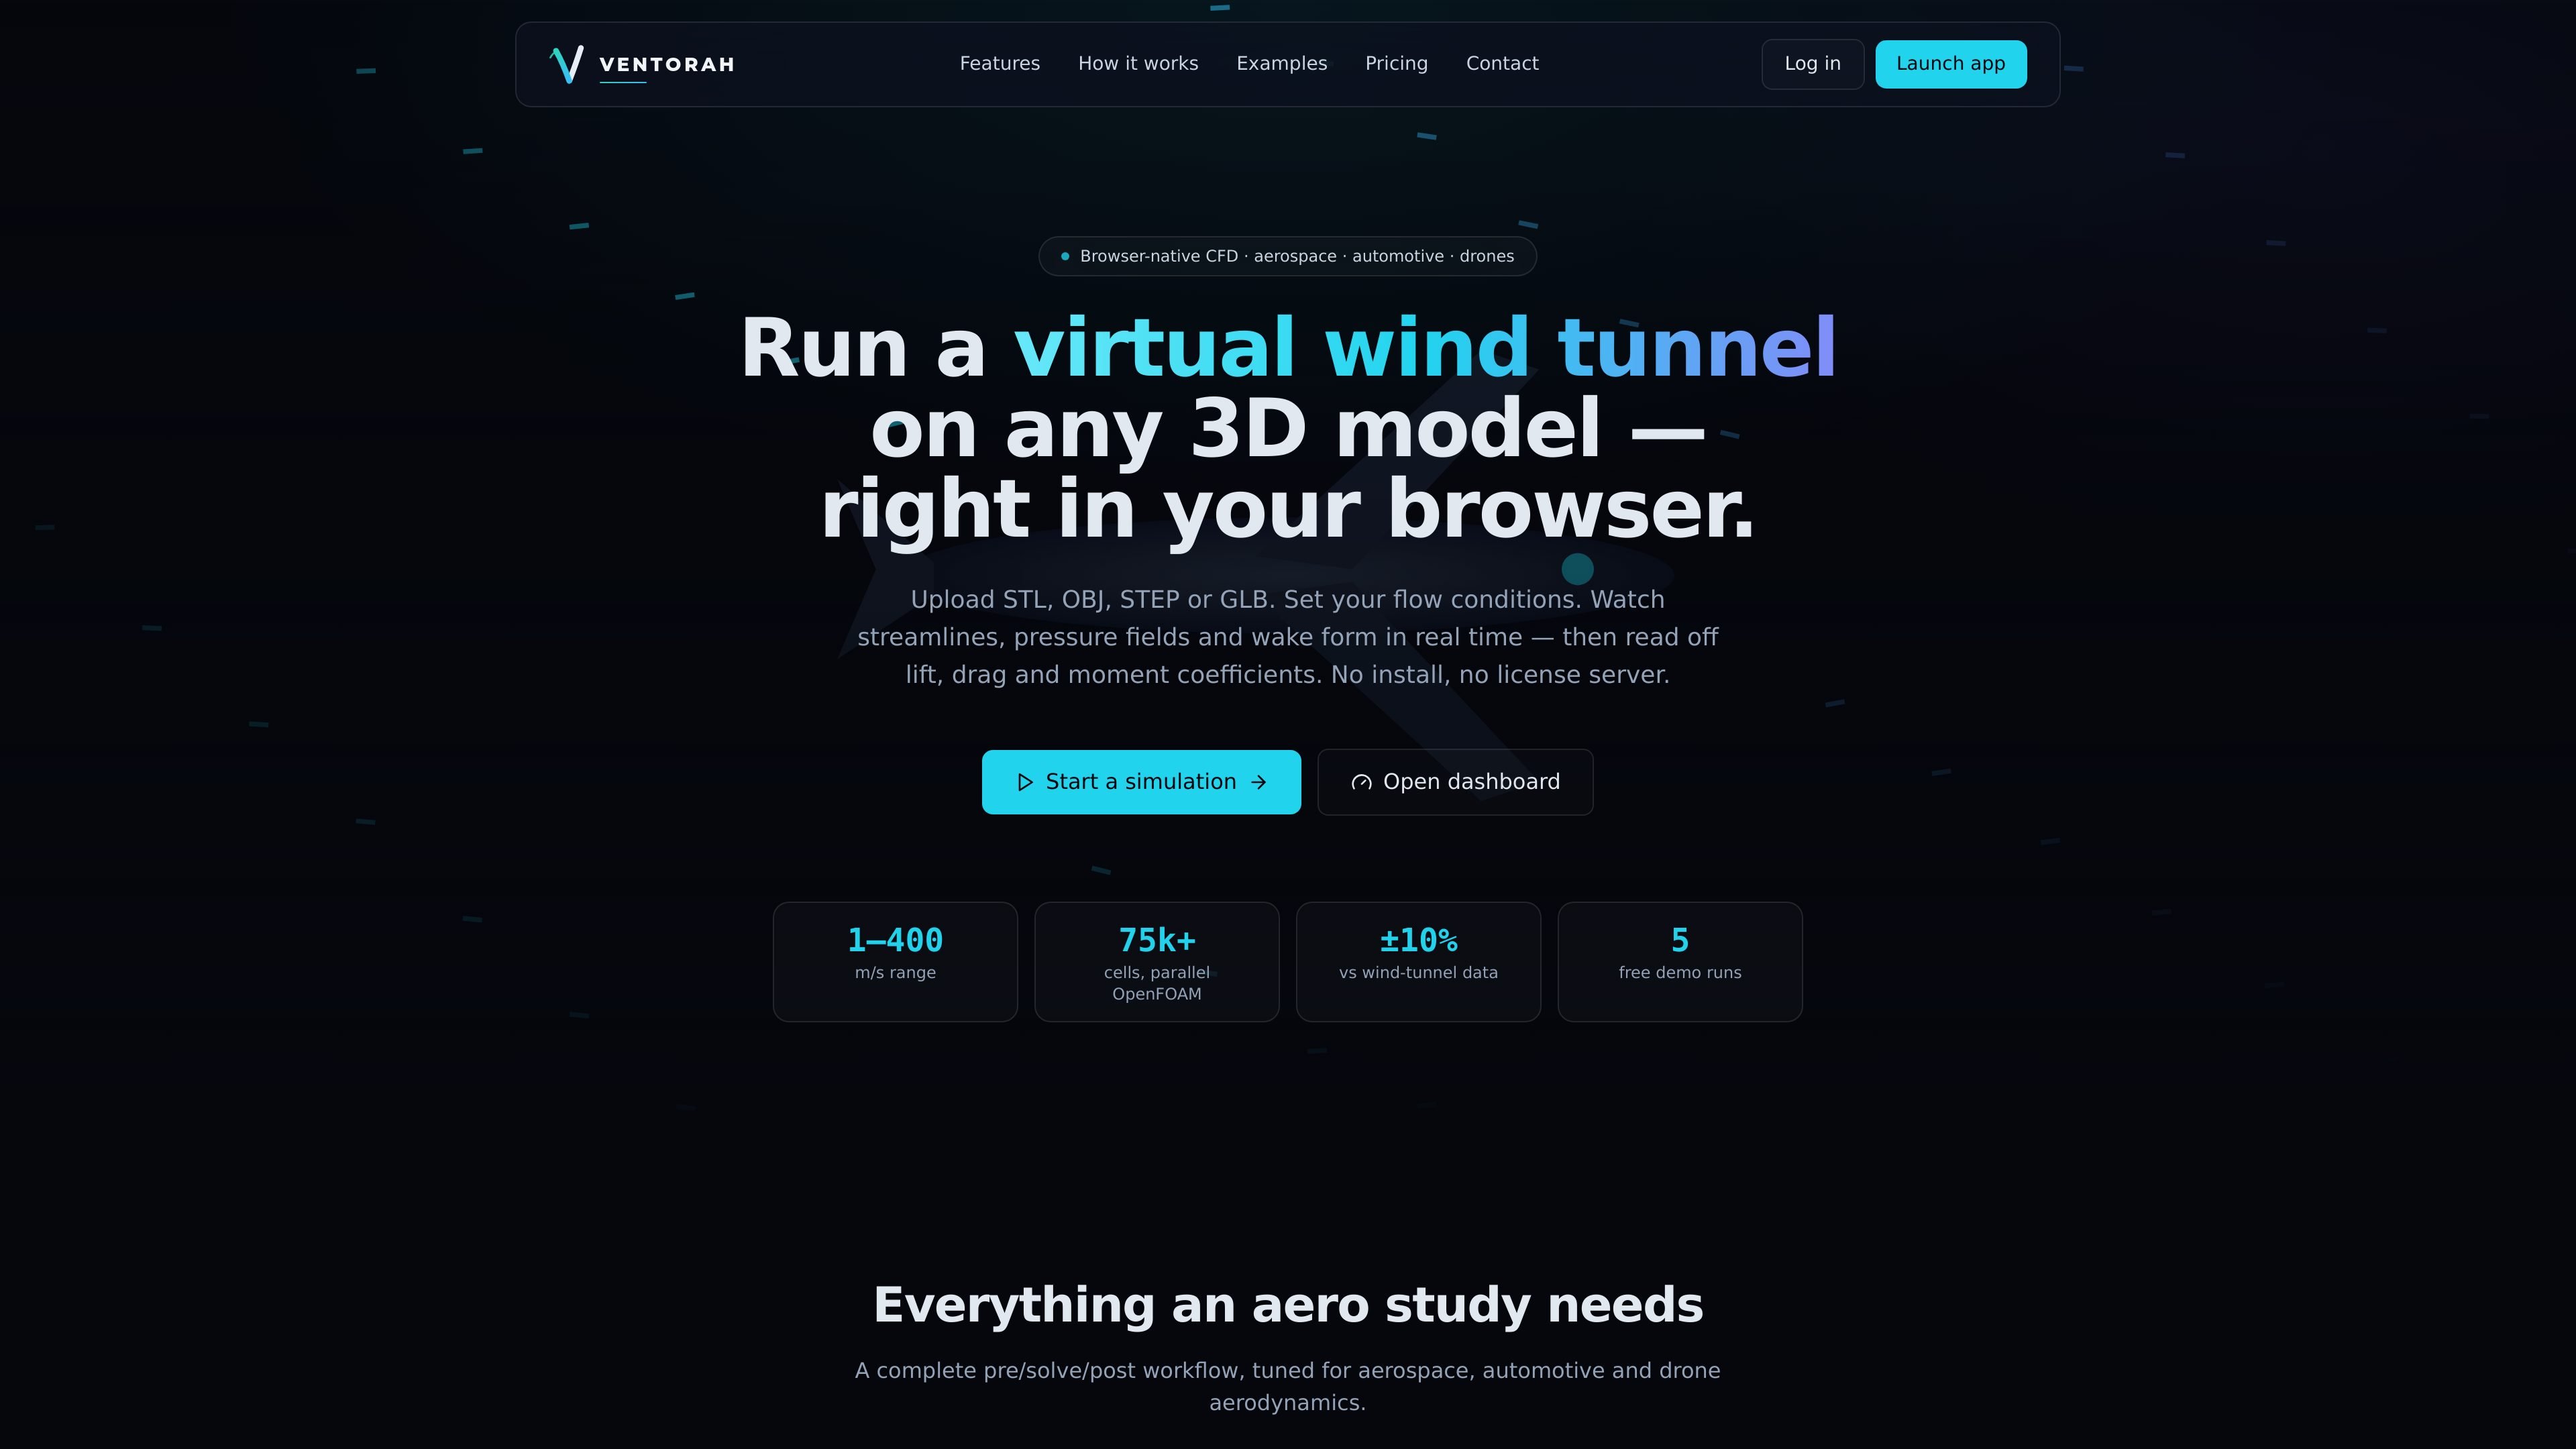

Ventorah is a browser-based CFD tool for virtual wind tunnel analysis on uploaded 3D models, with run, review, and export workflows.
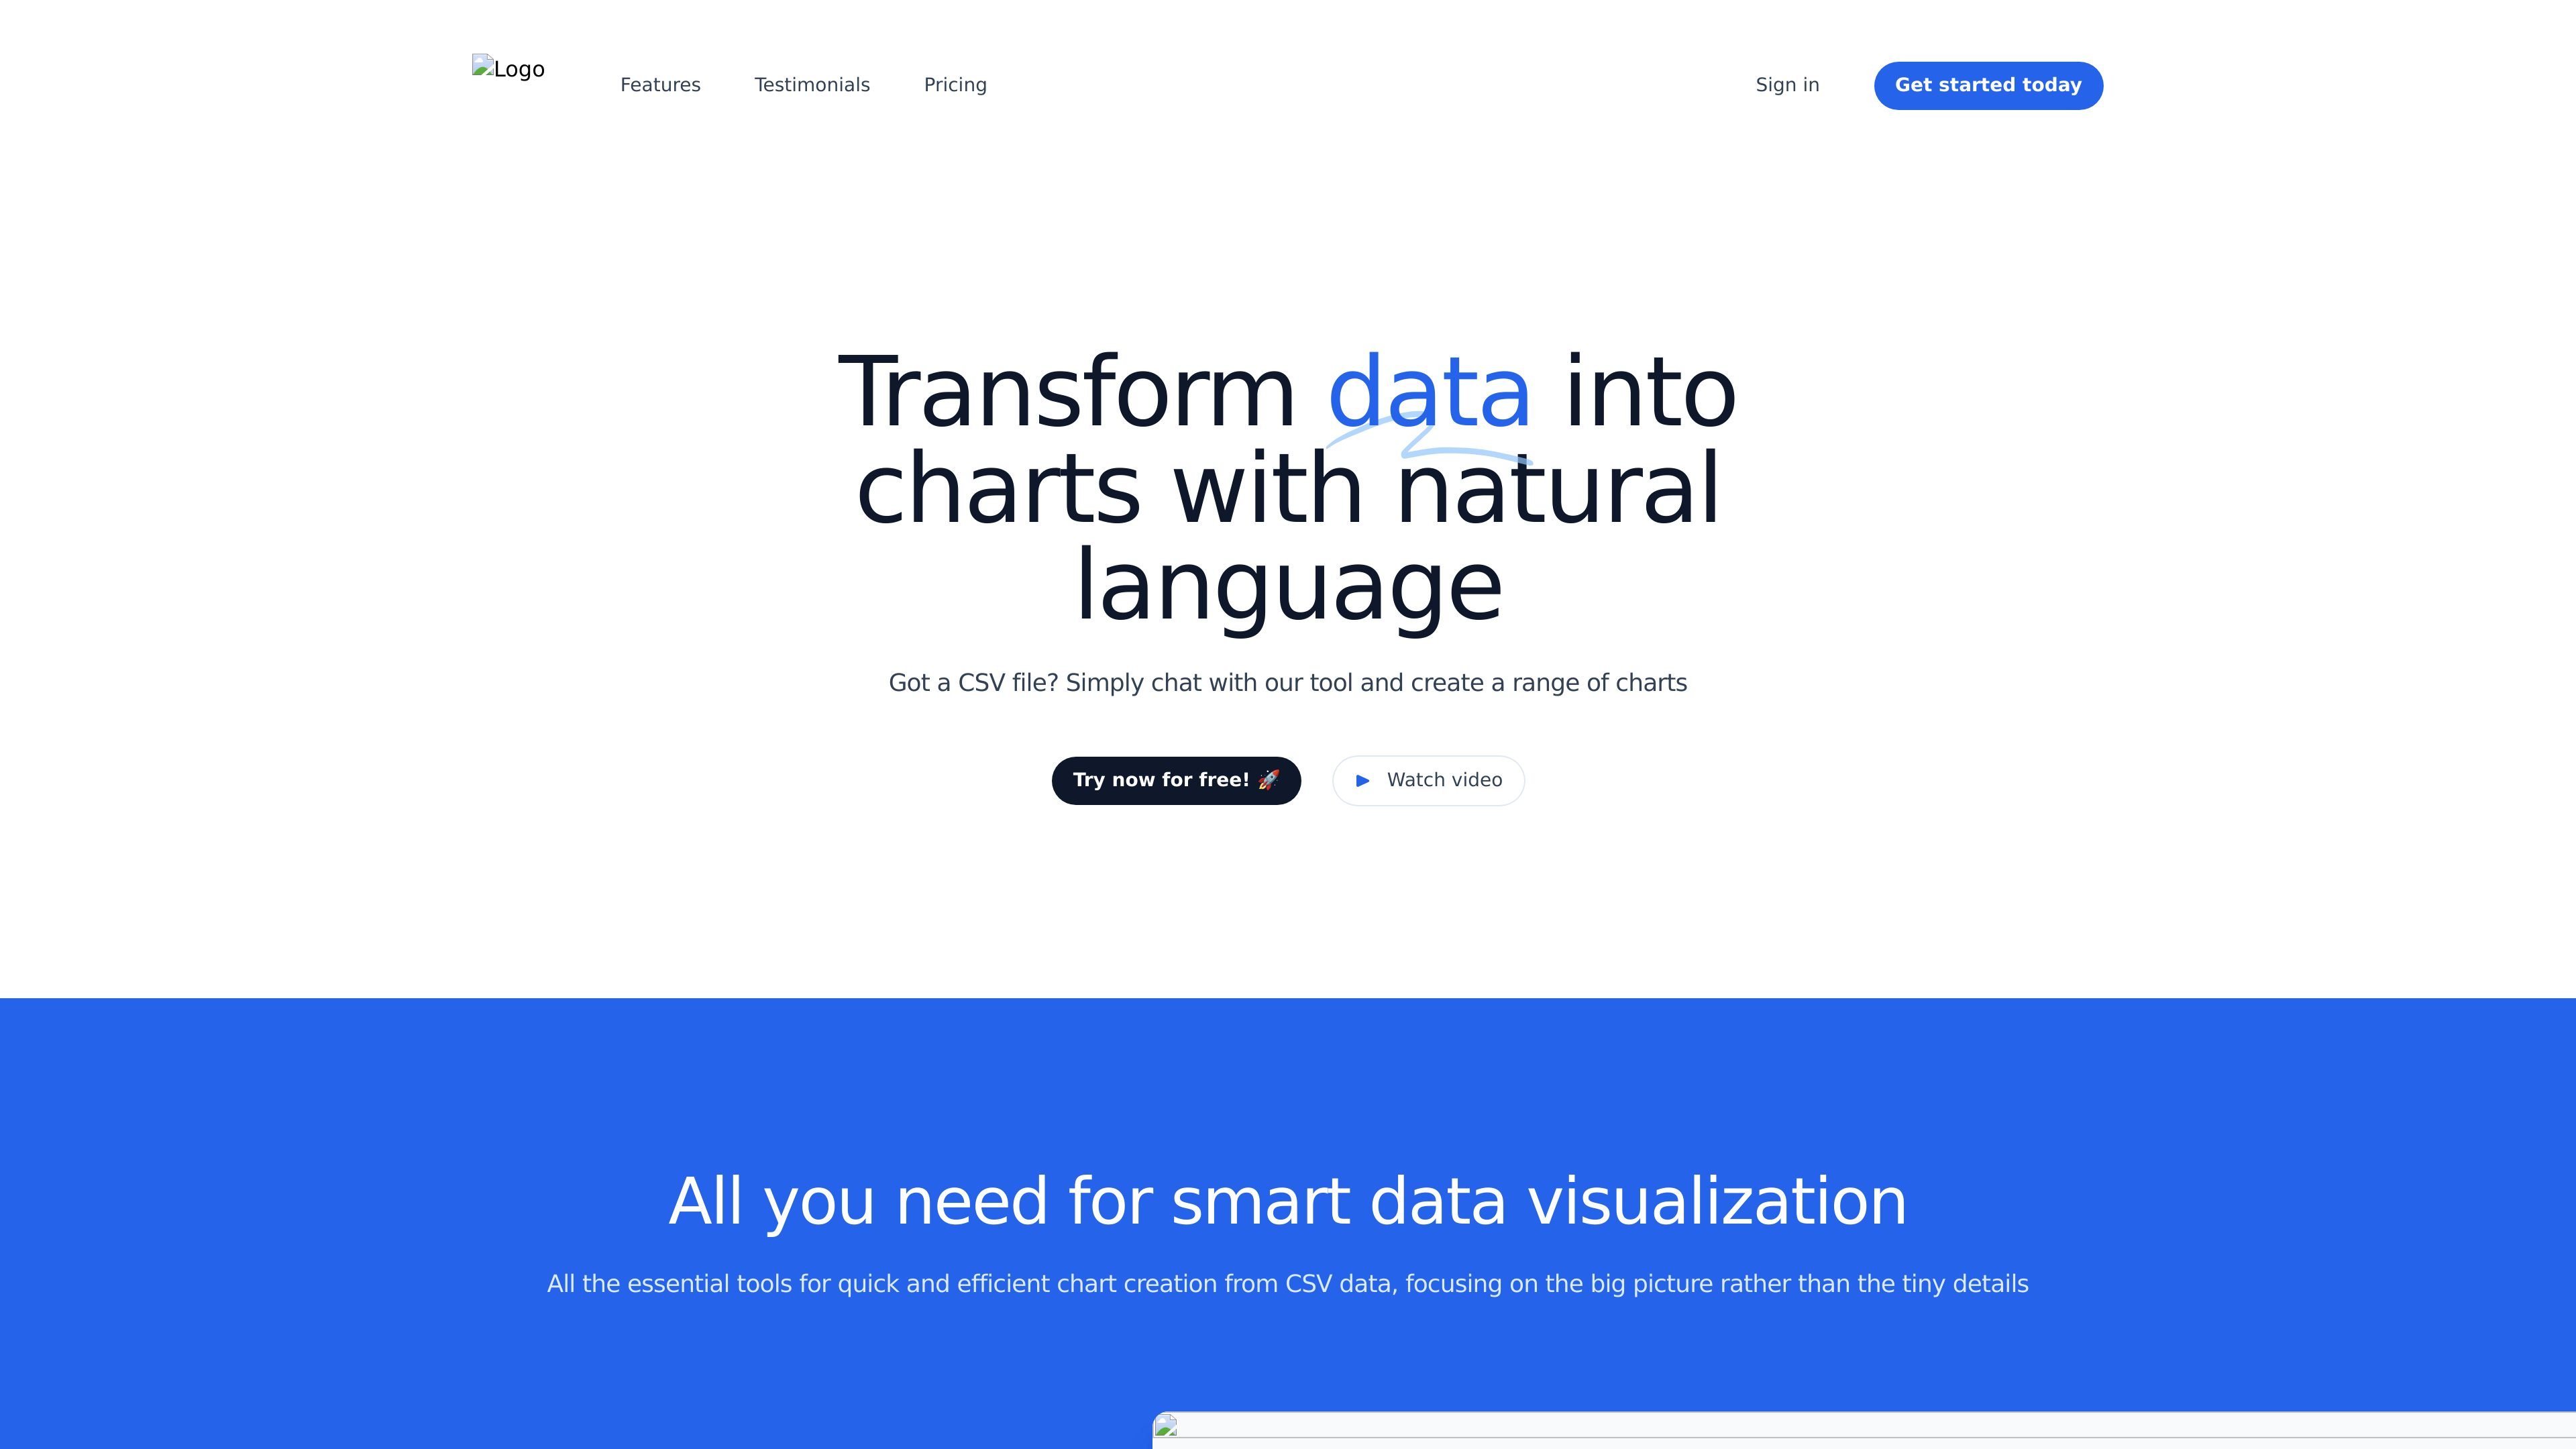

Chat2CSV turns CSV files into charts with natural-language prompts, privacy-focused handling, and a free tier for quick, no-code data visualization.
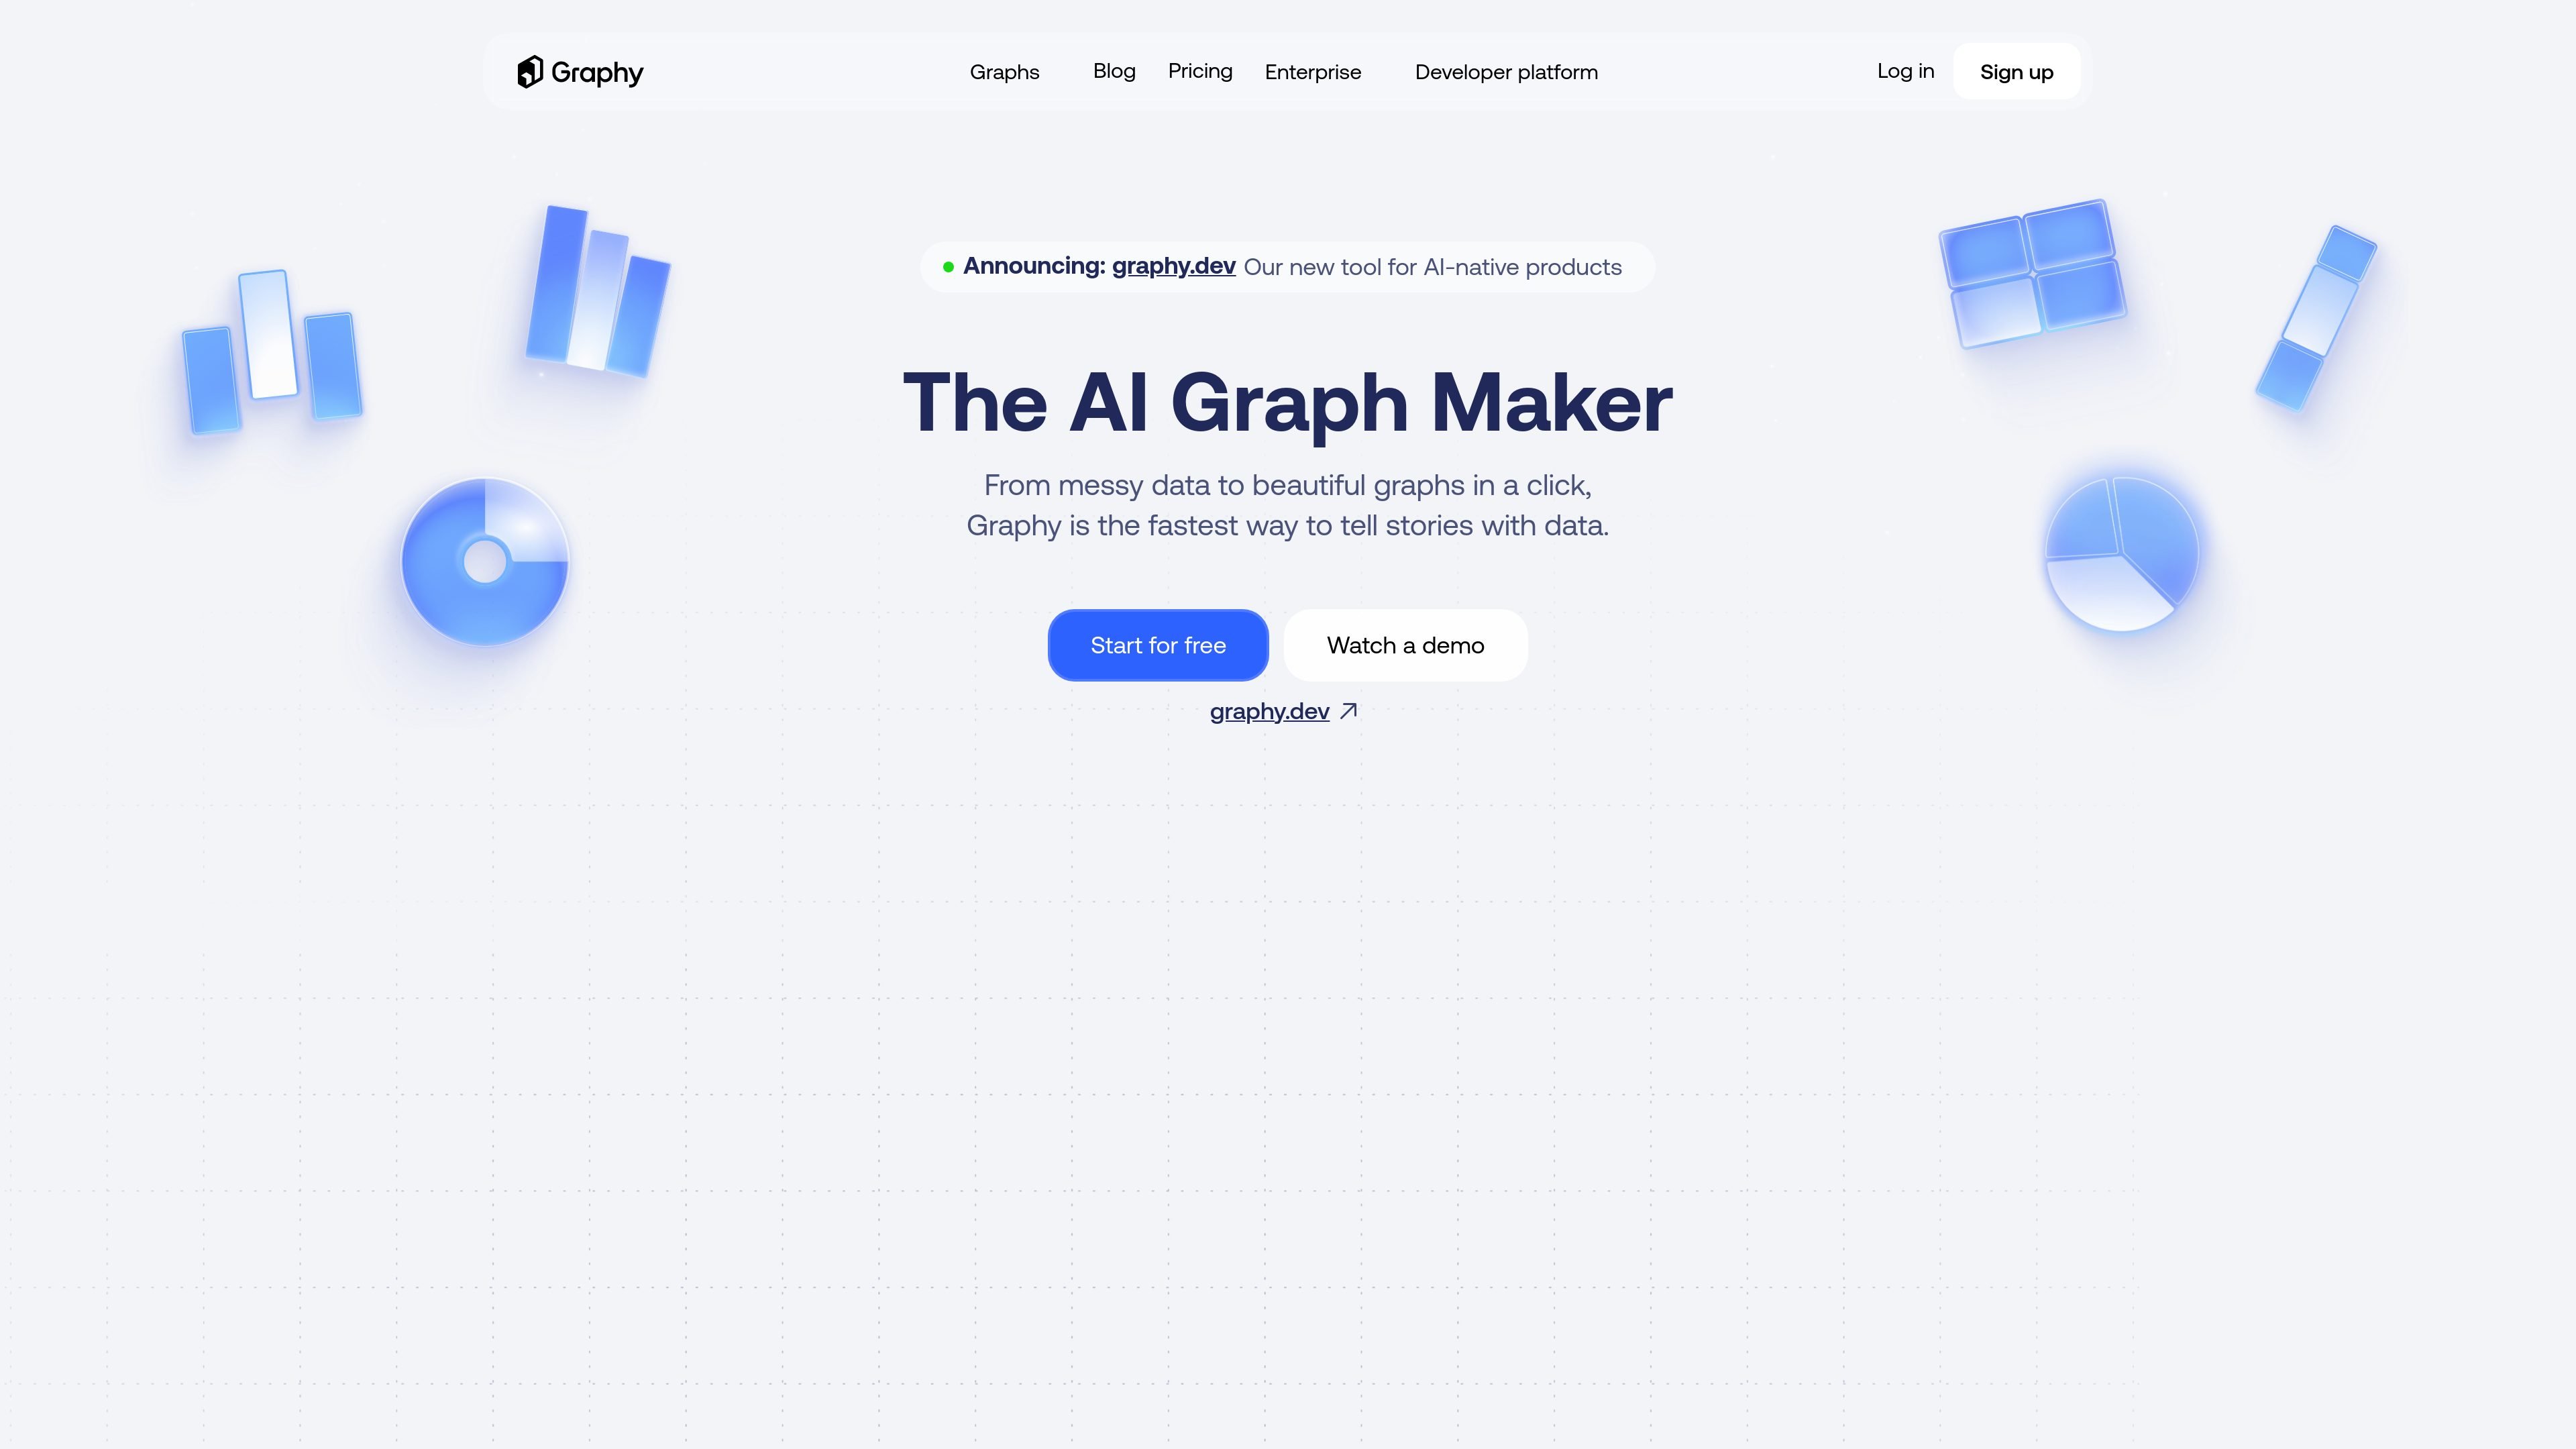

Graphy is a web-based charting tool for turning spreadsheet, file, API, or AI search data into shareable graphs and dashboards.


Basedash is an AI-native BI platform for connected data, asking questions, and generating dashboards and reports with cloud, self-hosted, and enterprise options.
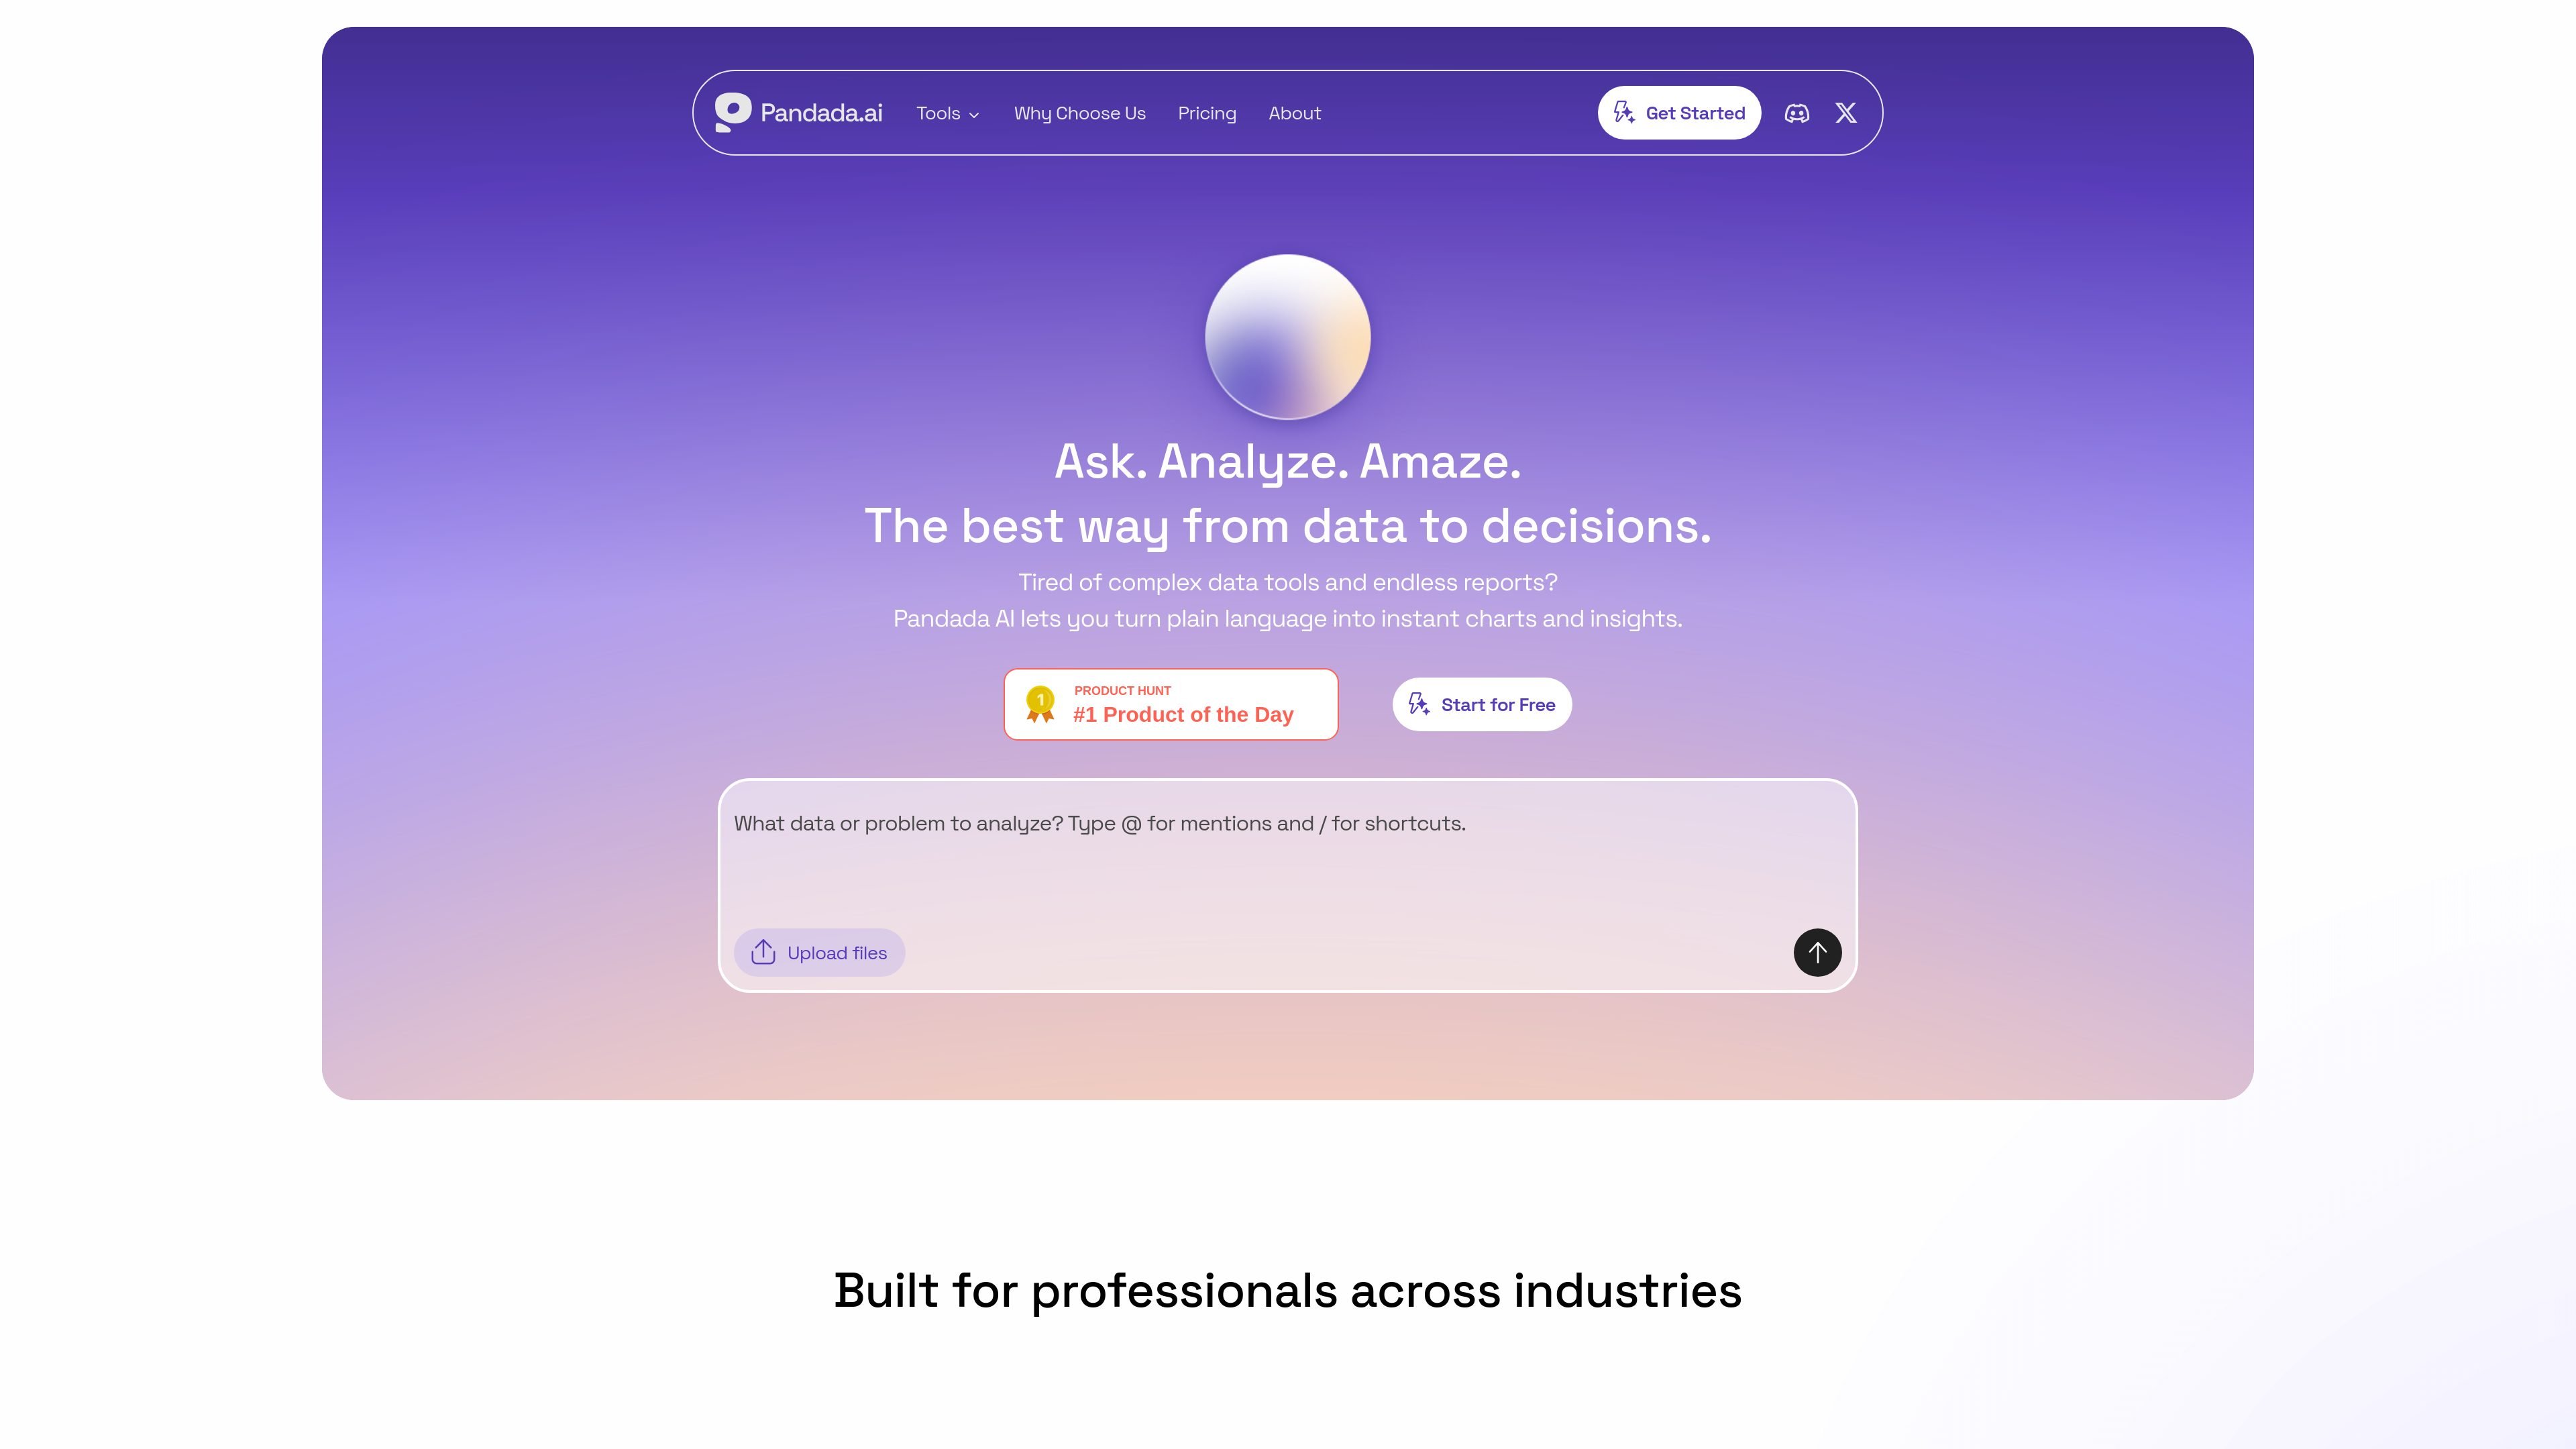

Pandada AI is a browser-based AI data analysis tool for students, researchers, and professionals to clean files, ask questions in plain language, and create charts or reports.
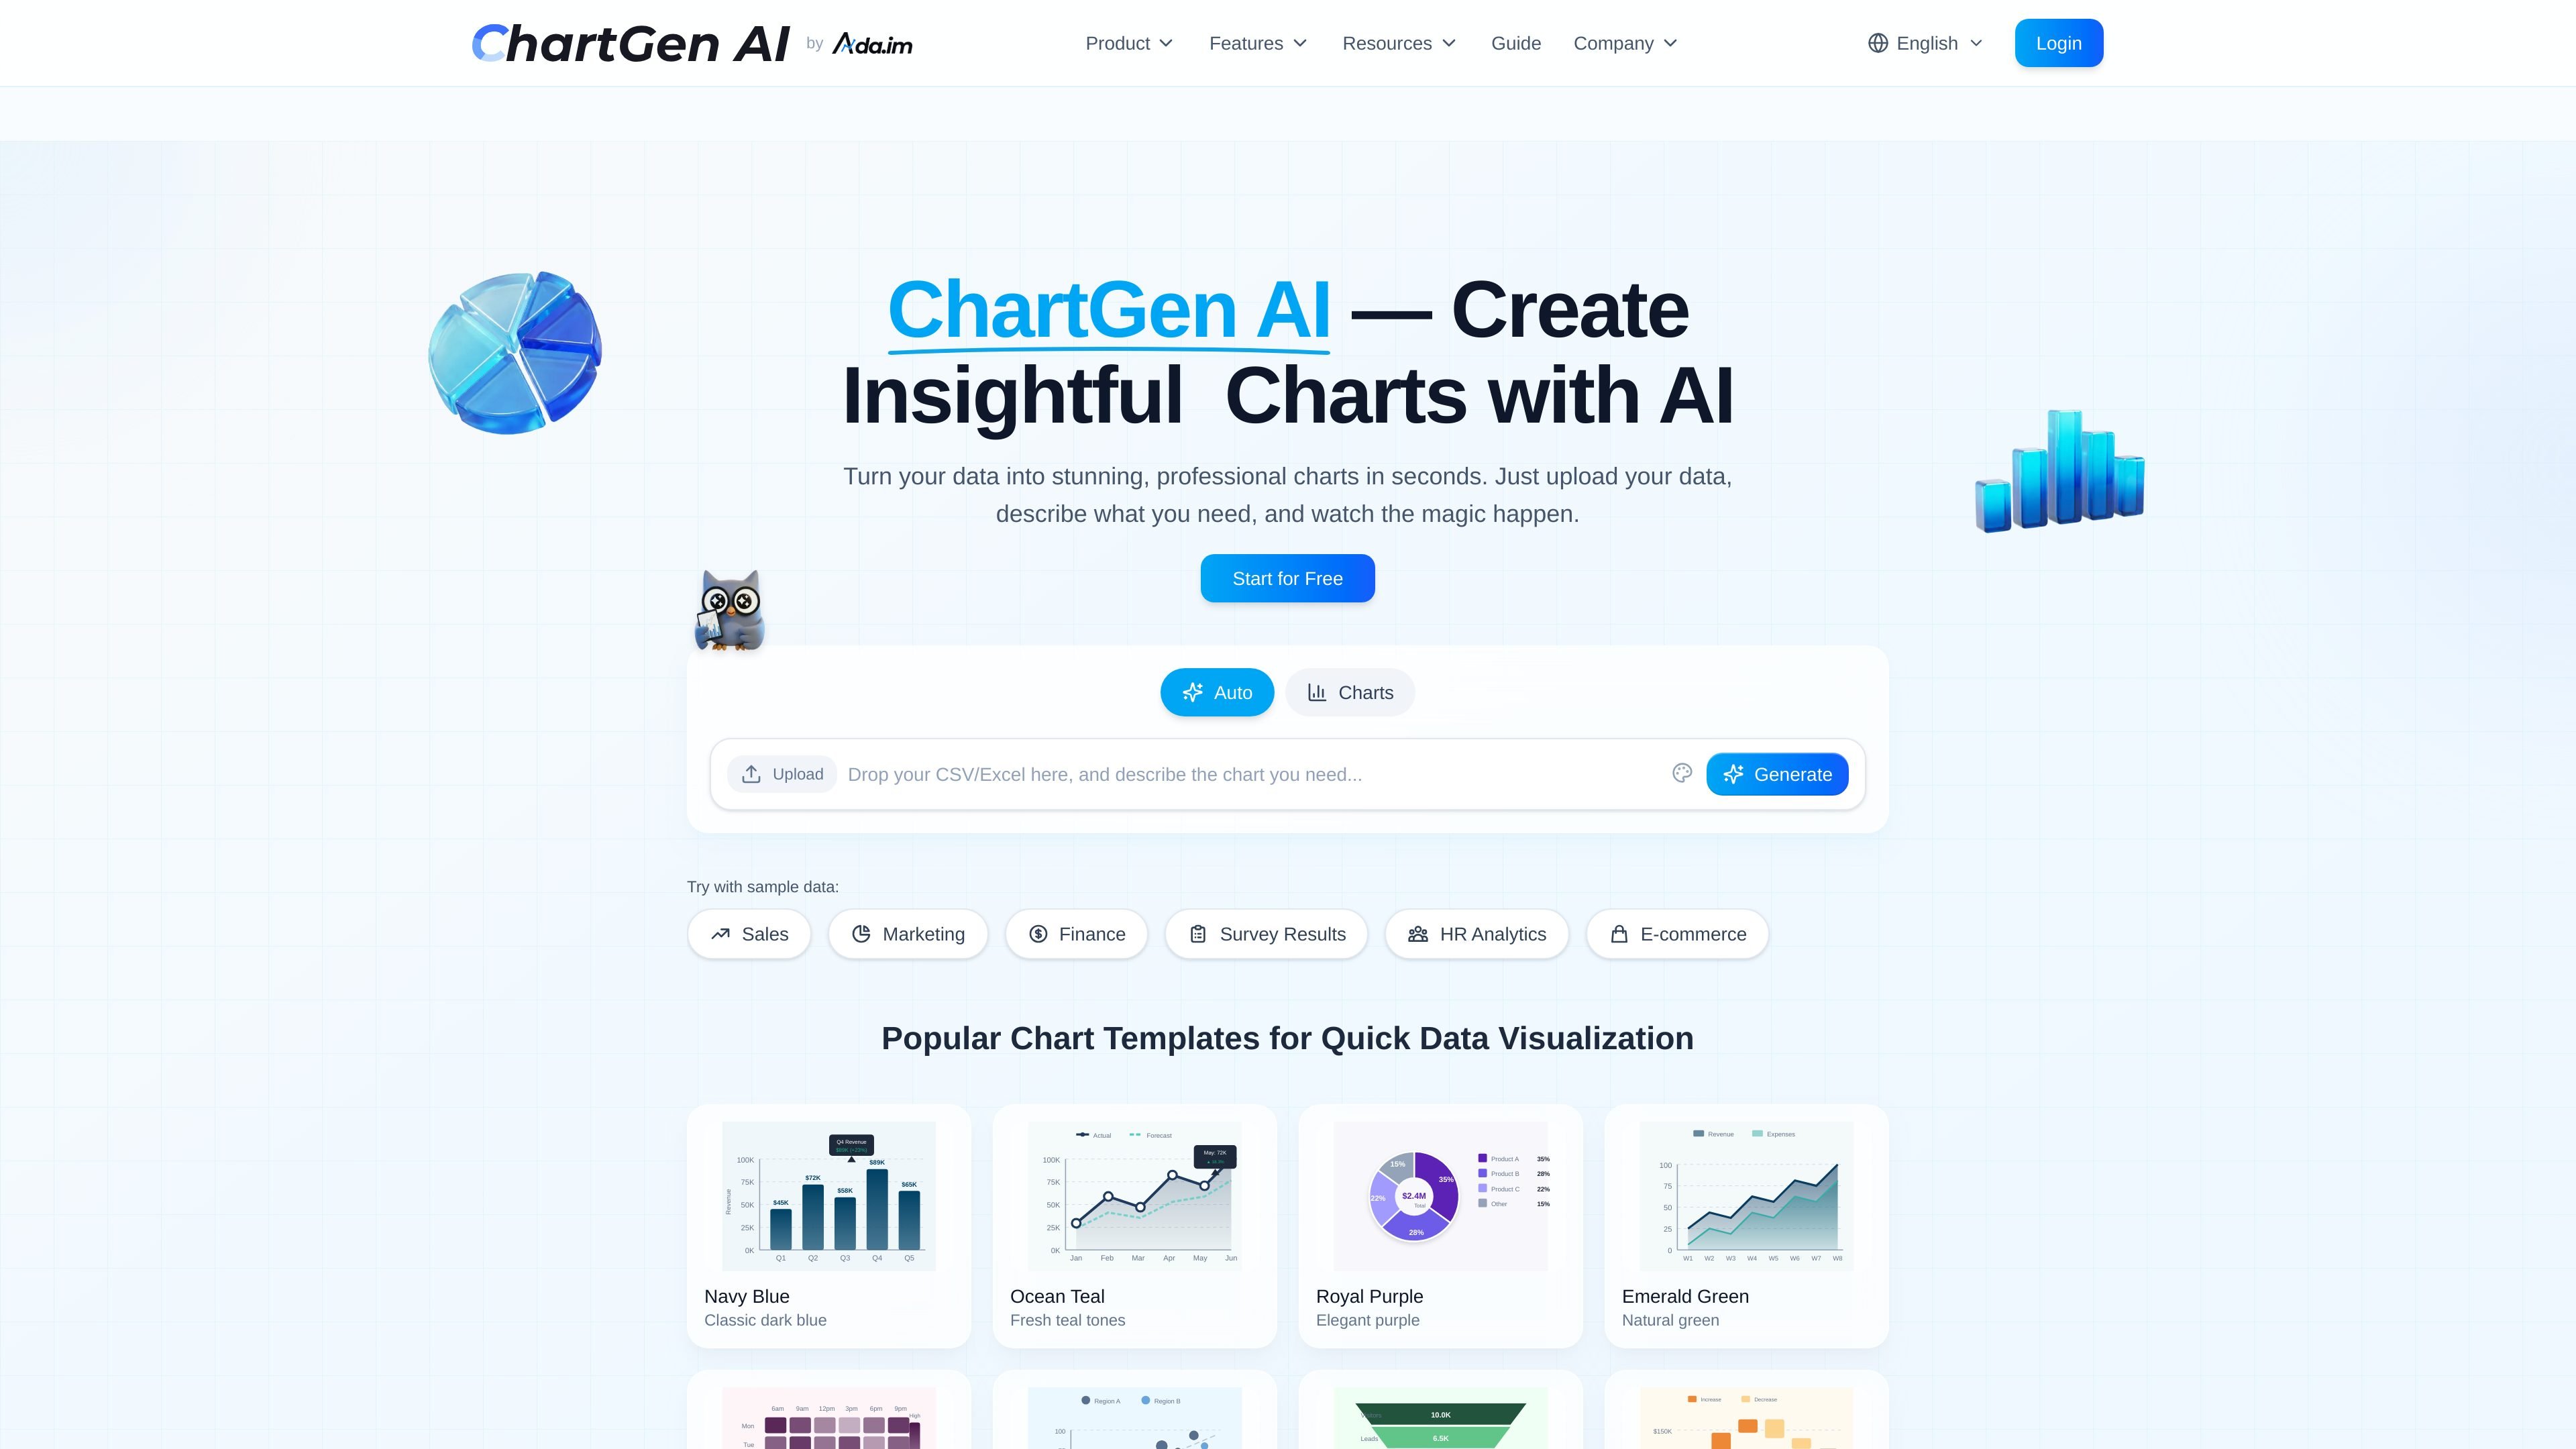

ChartGen AI is a web-based AI chart generator that turns CSV, Excel, pasted data, or connected sources into charts and dashboards. It helps users create and export visuals quickly using natural-language prompts.
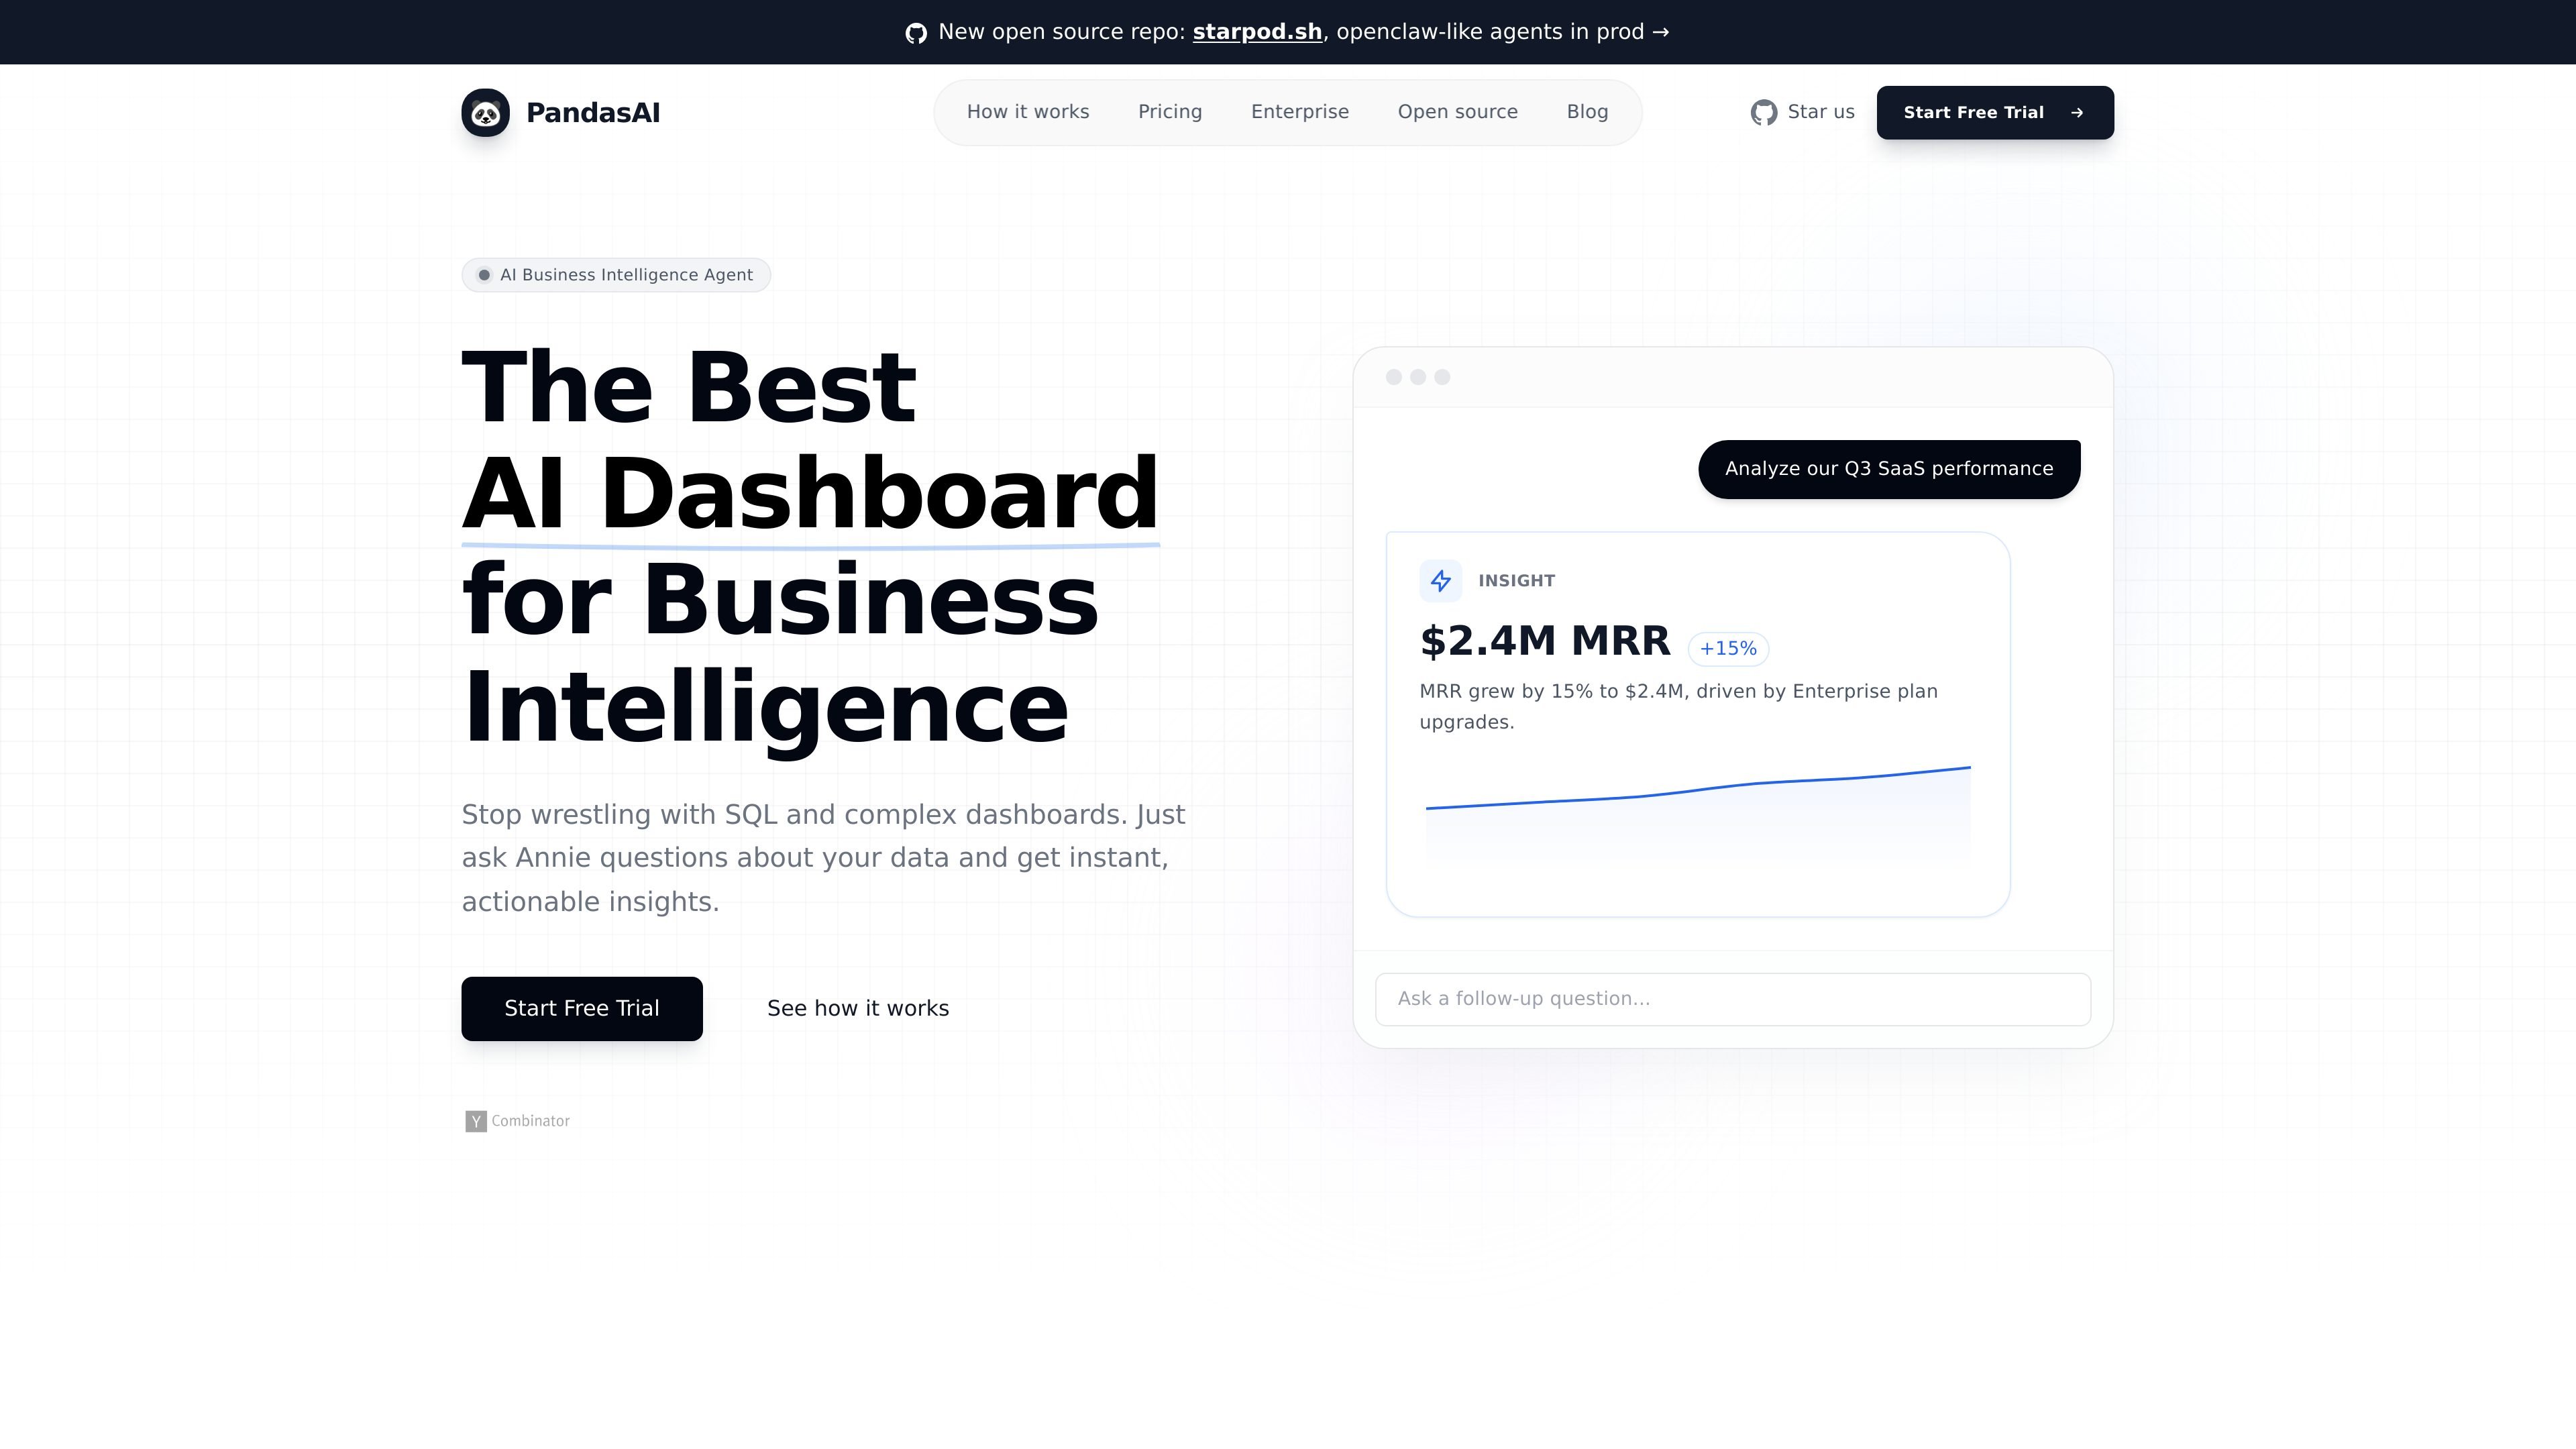

PandasAI is an AI dashboard for business intelligence that lets you ask about your data and get charts, dashboards, and analysis with no-code workflows.
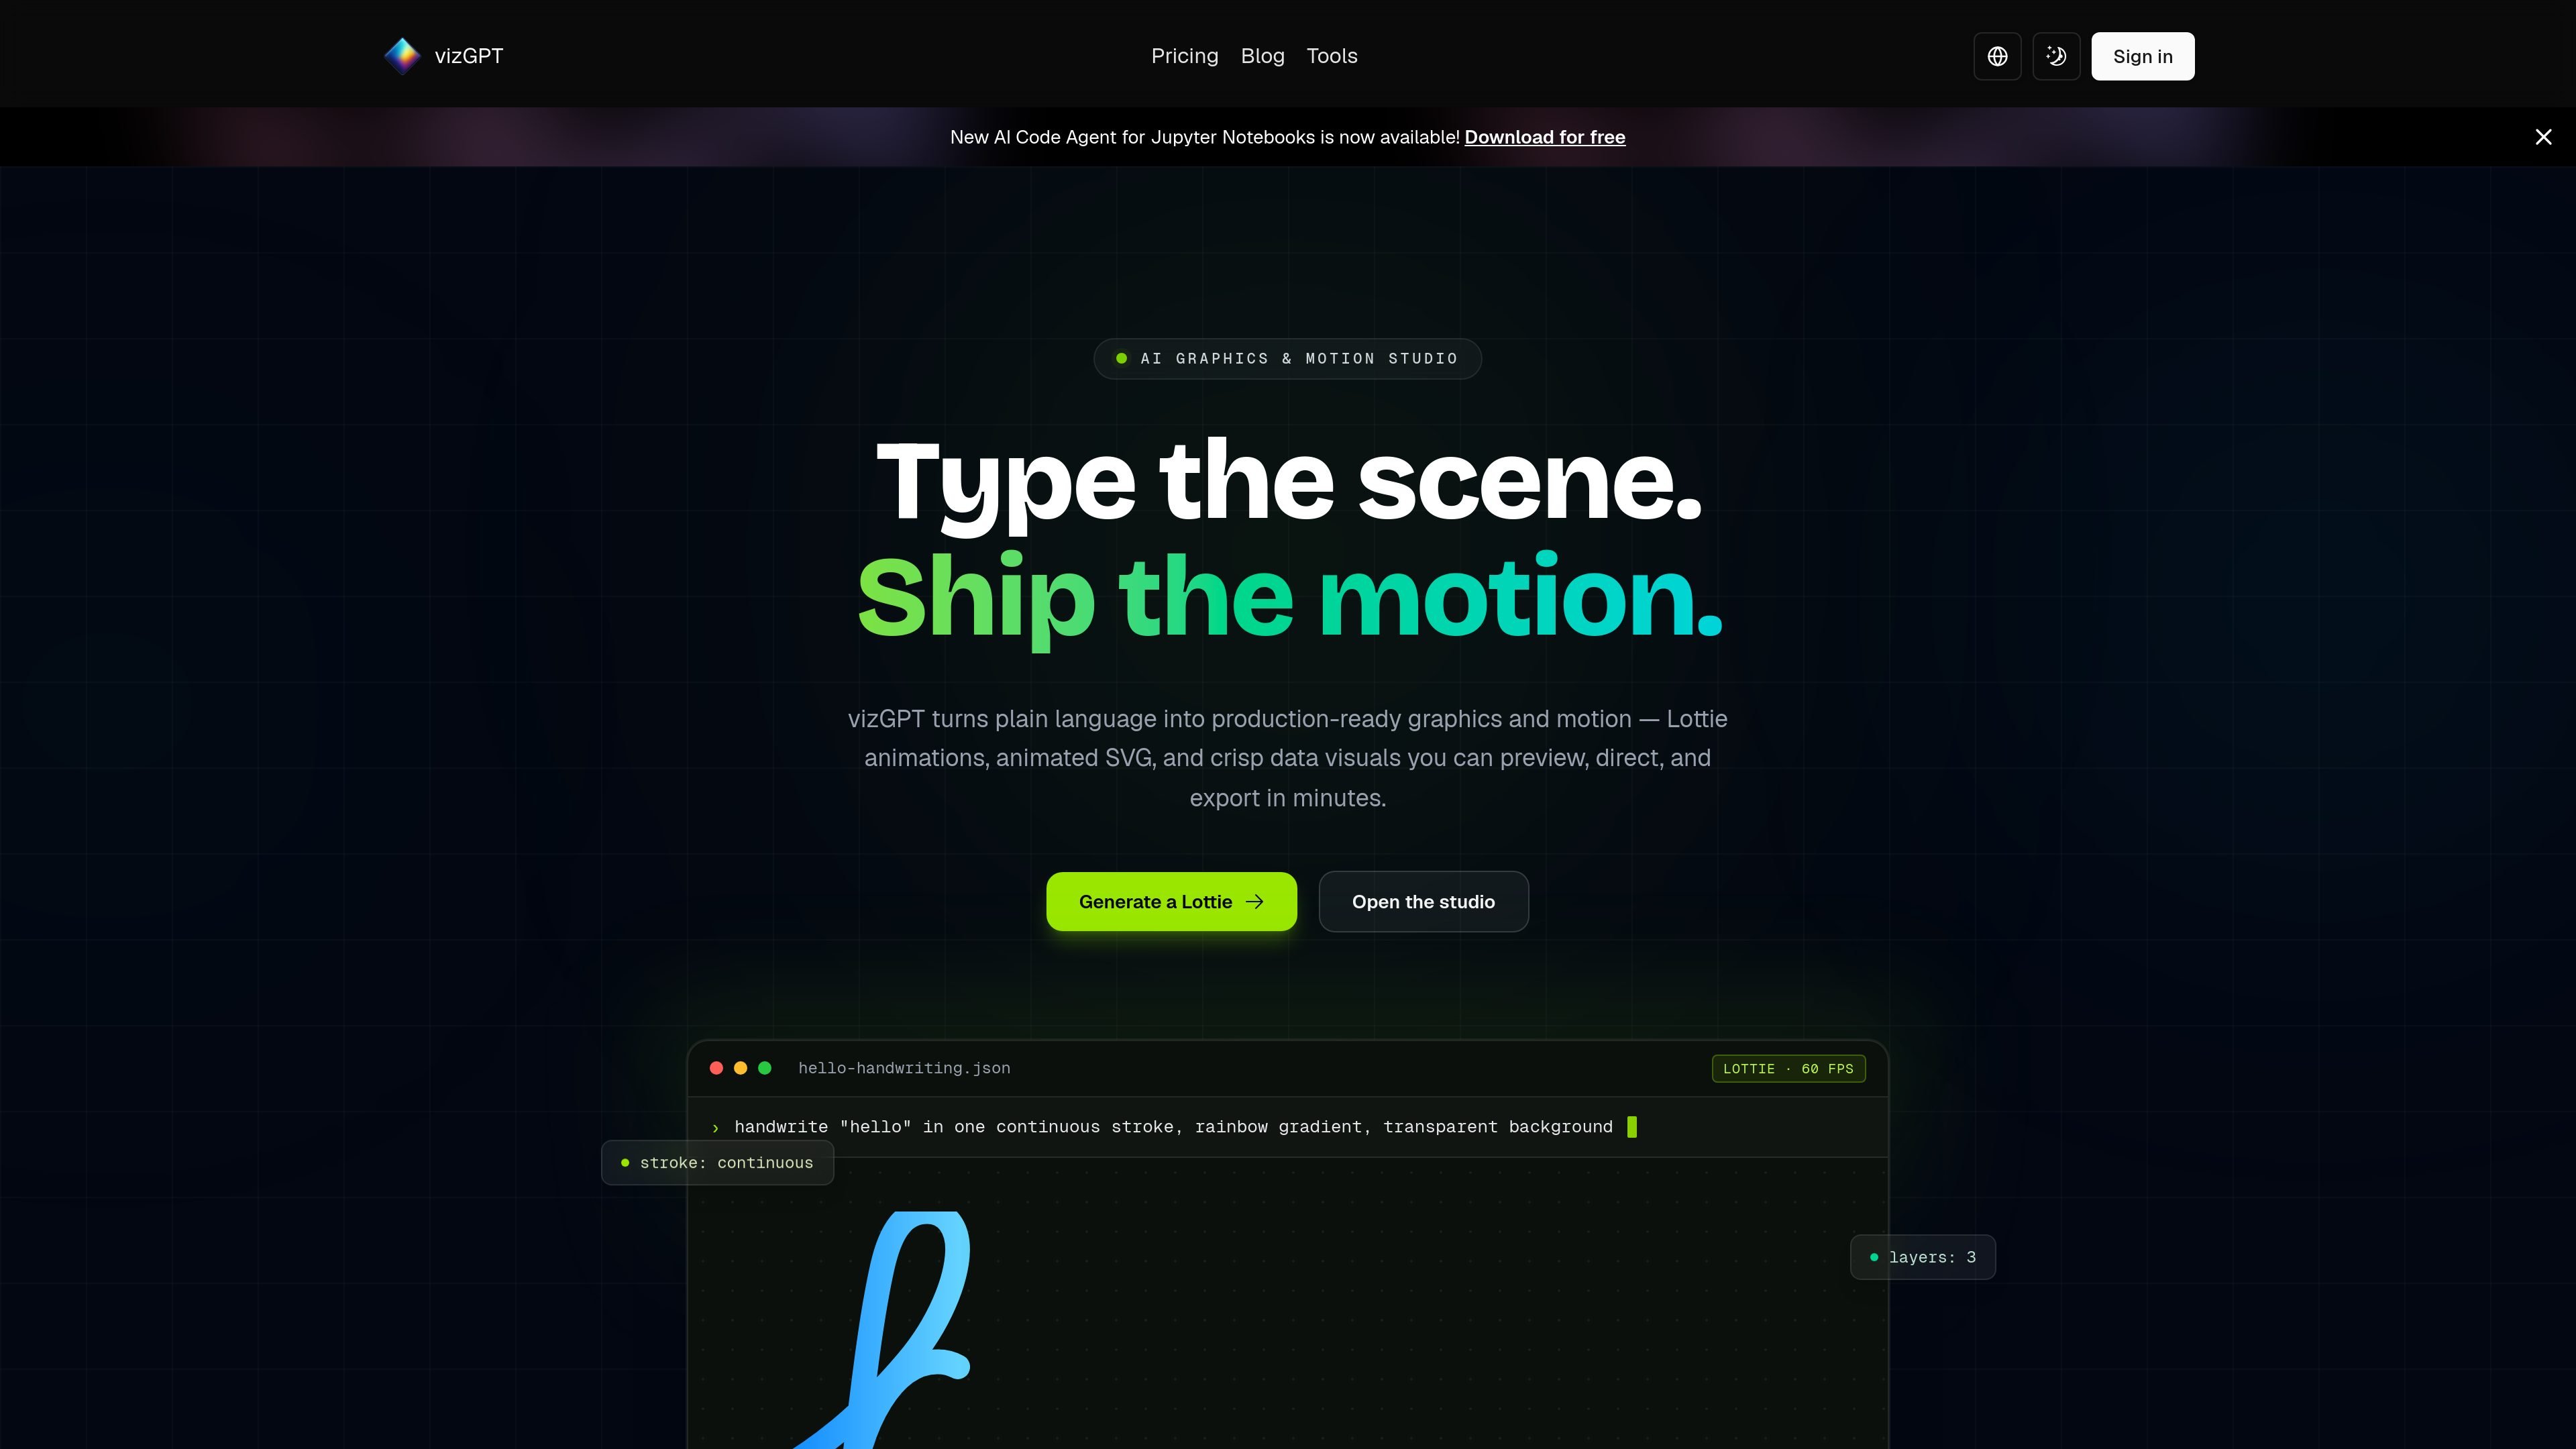

vizGPT is an AI graphics and motion studio that turns plain-language prompts into Lottie animations, animated SVG, GIF exports, and data graphics. It is aimed at product, design, marketing, and frontend workflows that need editable motion assets and lightweight visual output.
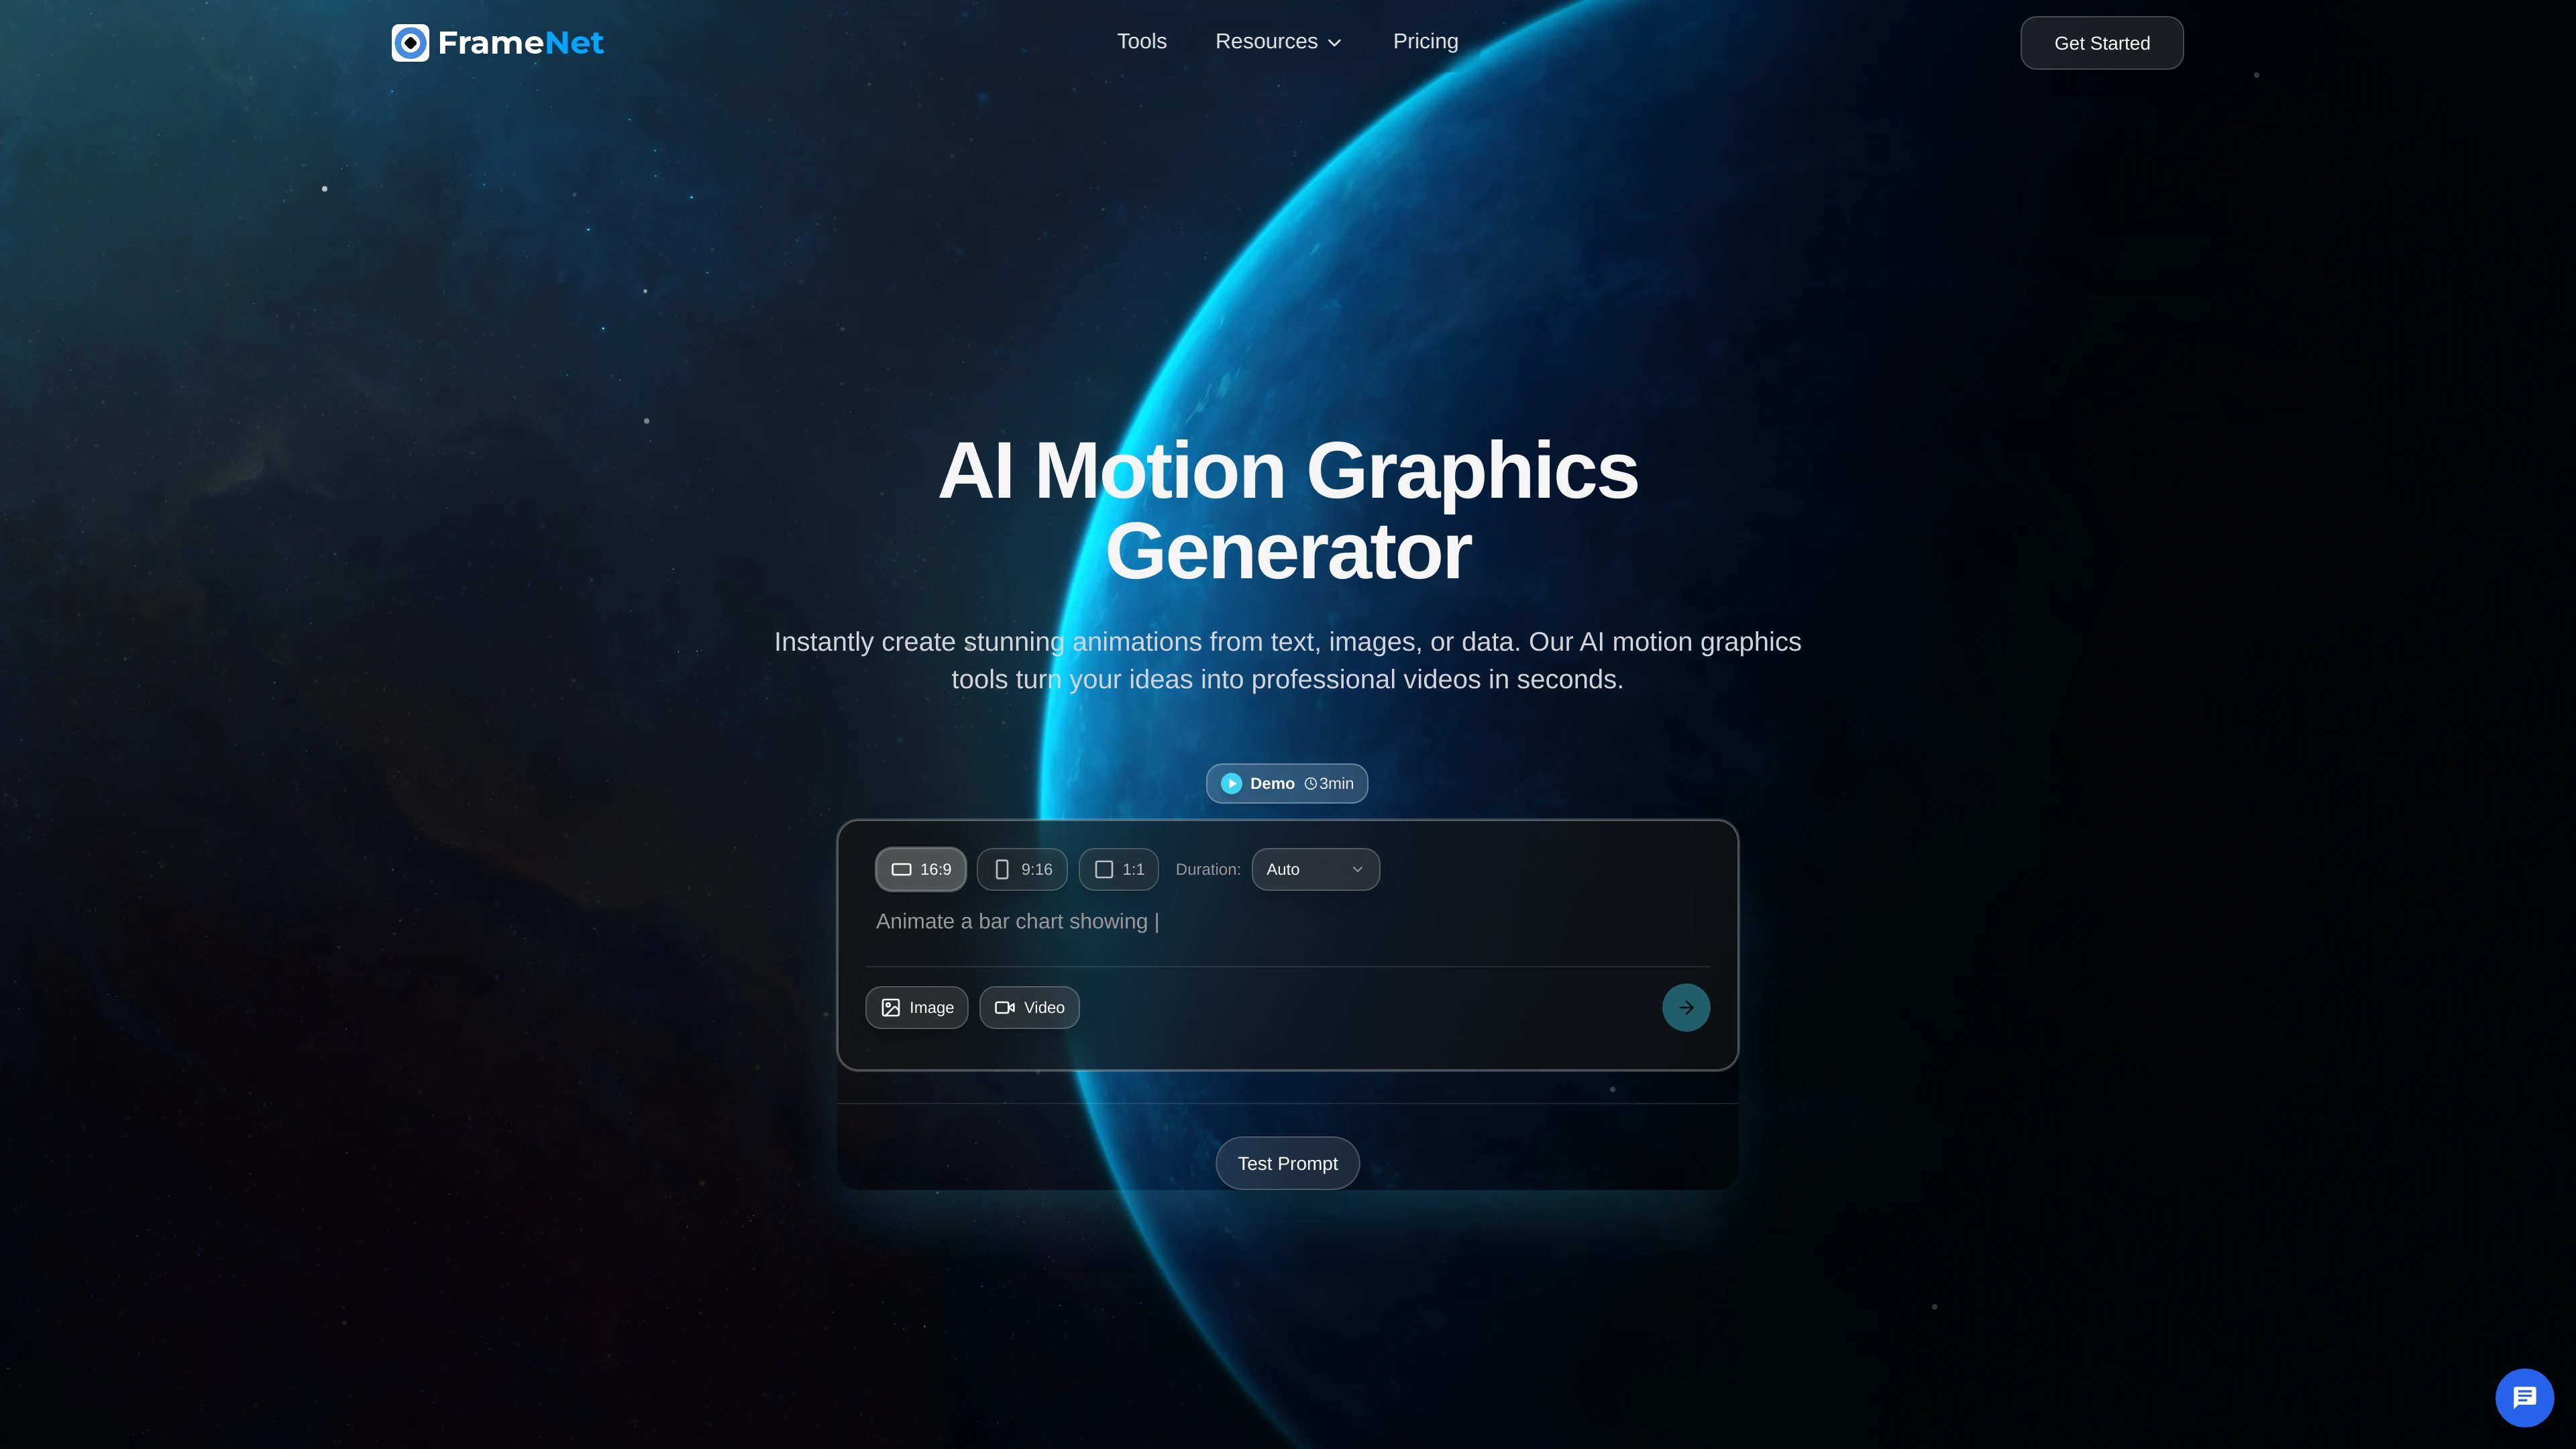

FrameNet is an AI motion graphics generator for designers, marketers, and content creators. It turns prompts, images, or data into animated motion graphics and supports a guided workflow from generation to export.
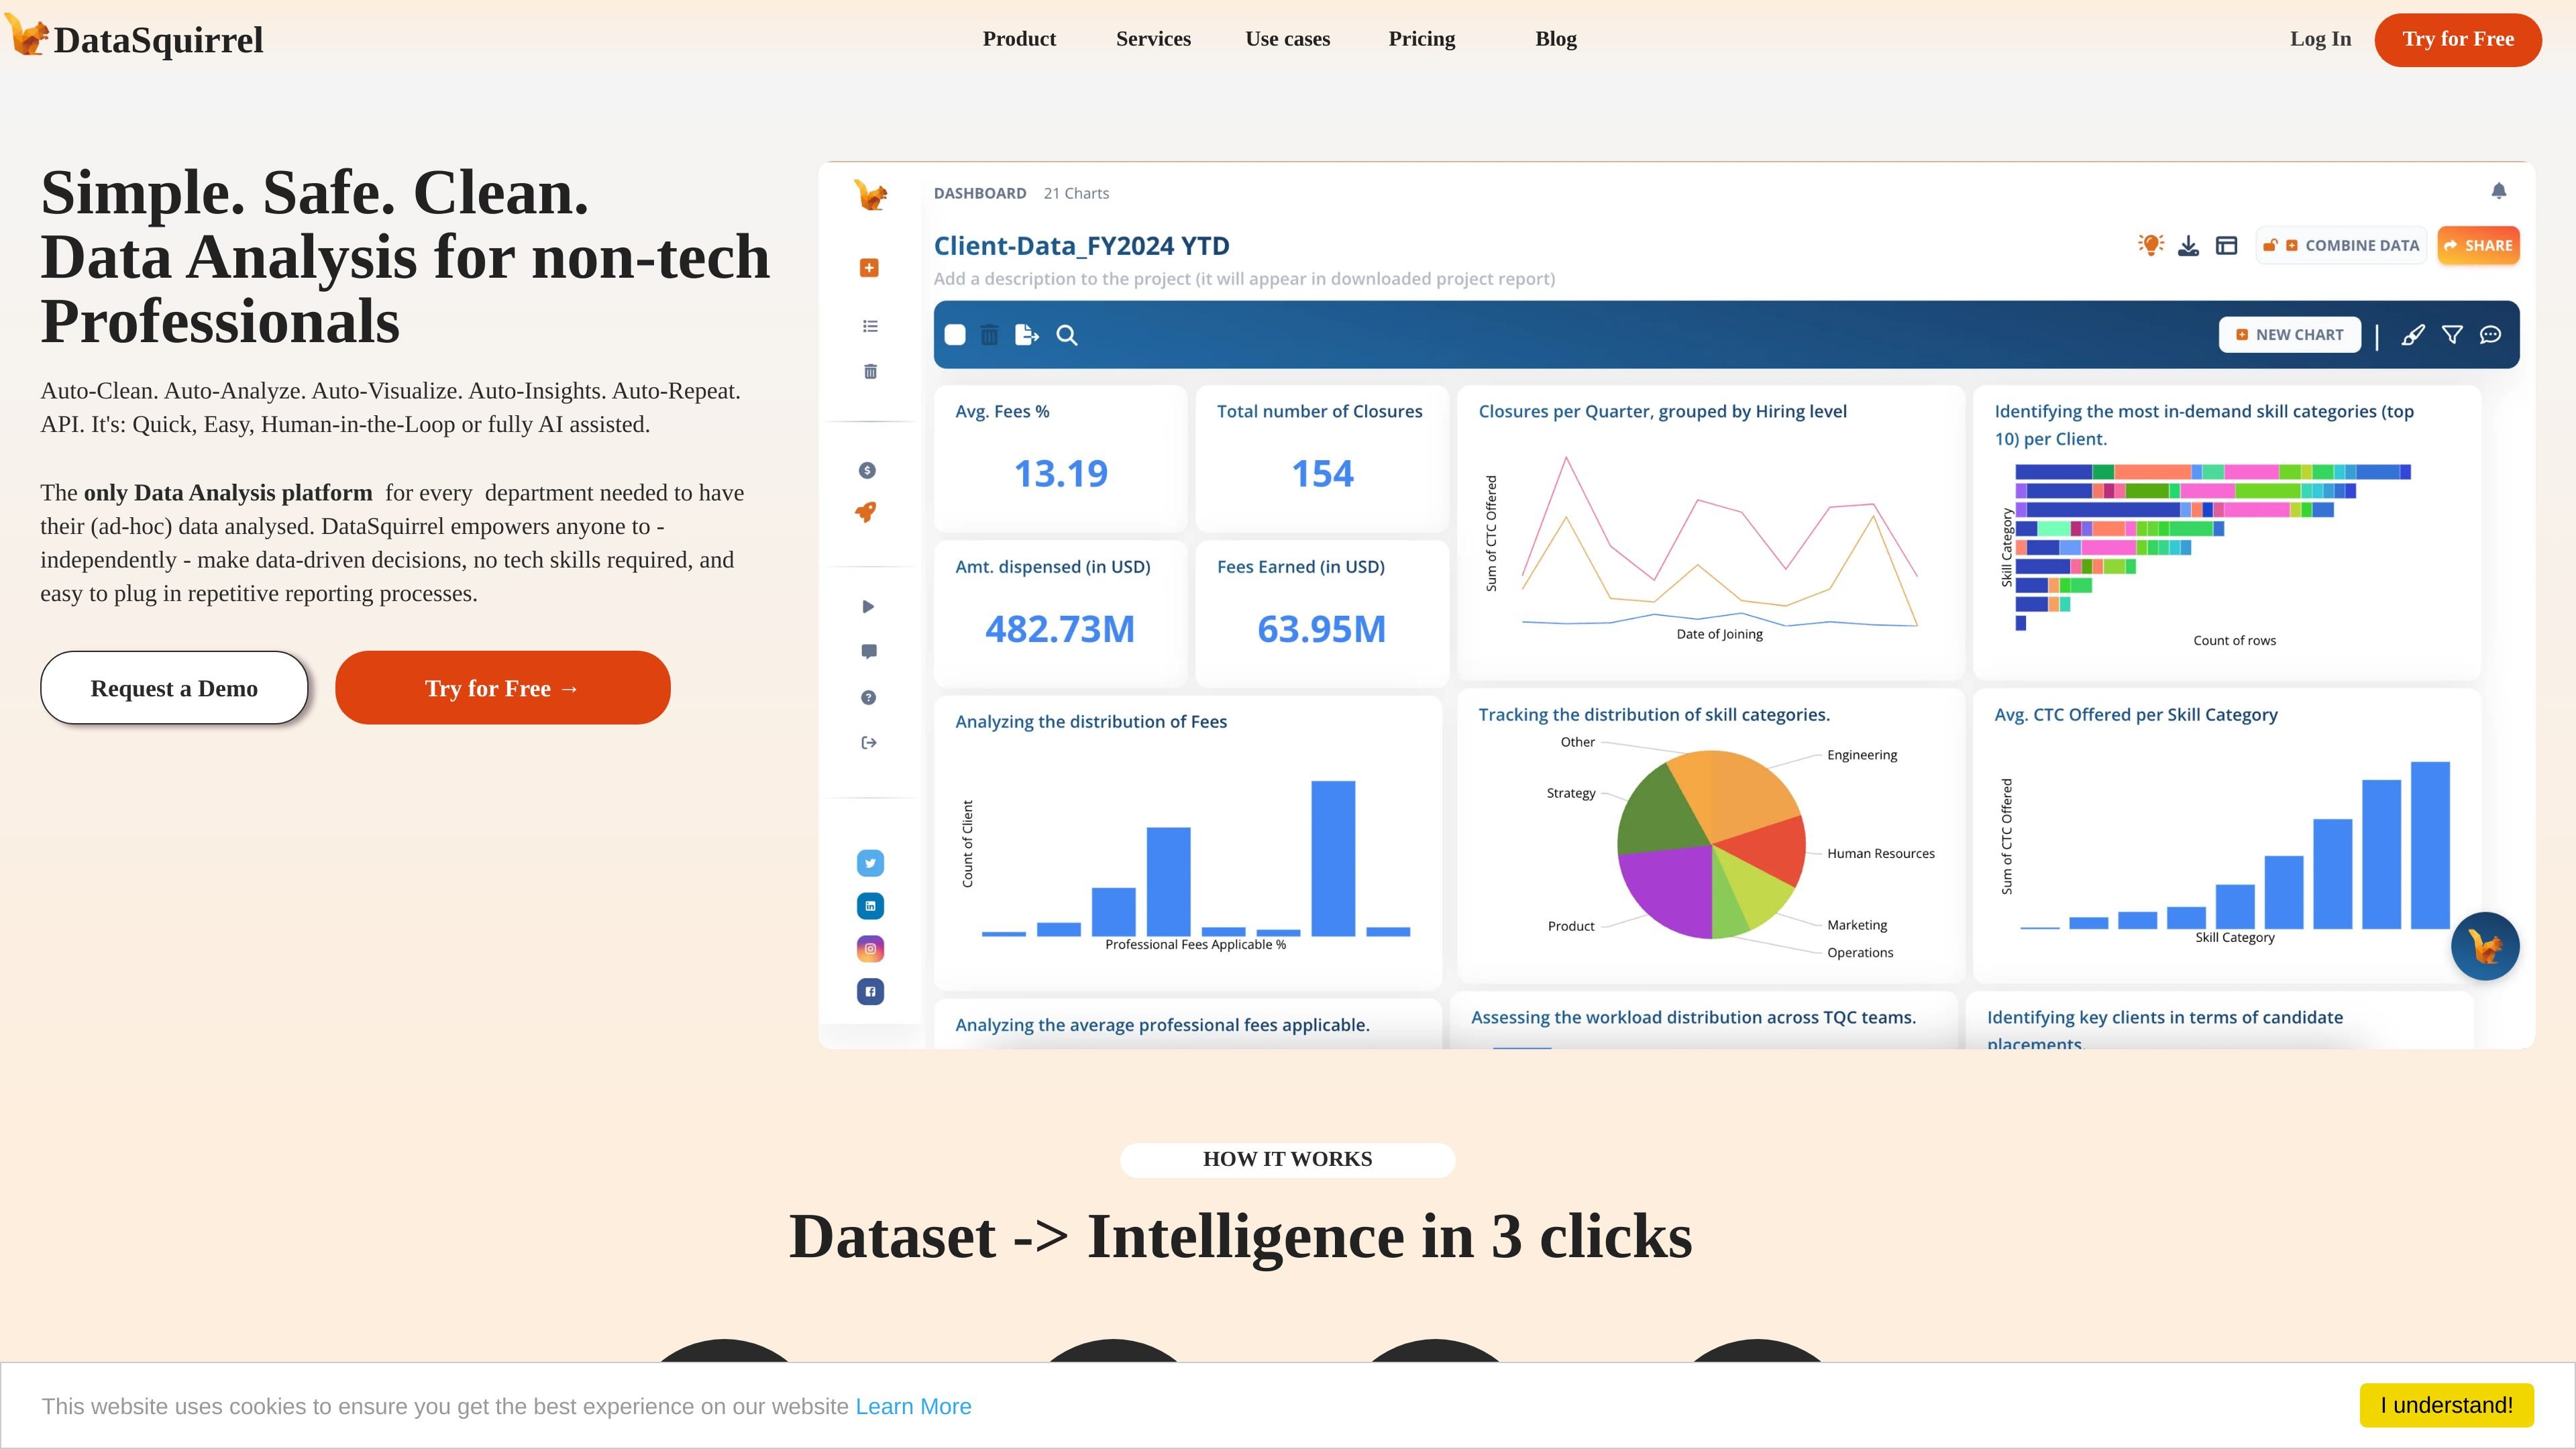

DataSquirrel.ai is a web-based AI data analysis platform for non-technical business users. It helps teams clean, analyze, visualize, and share spreadsheet and connected data without formulas, pivot tables, SQL, or coding.
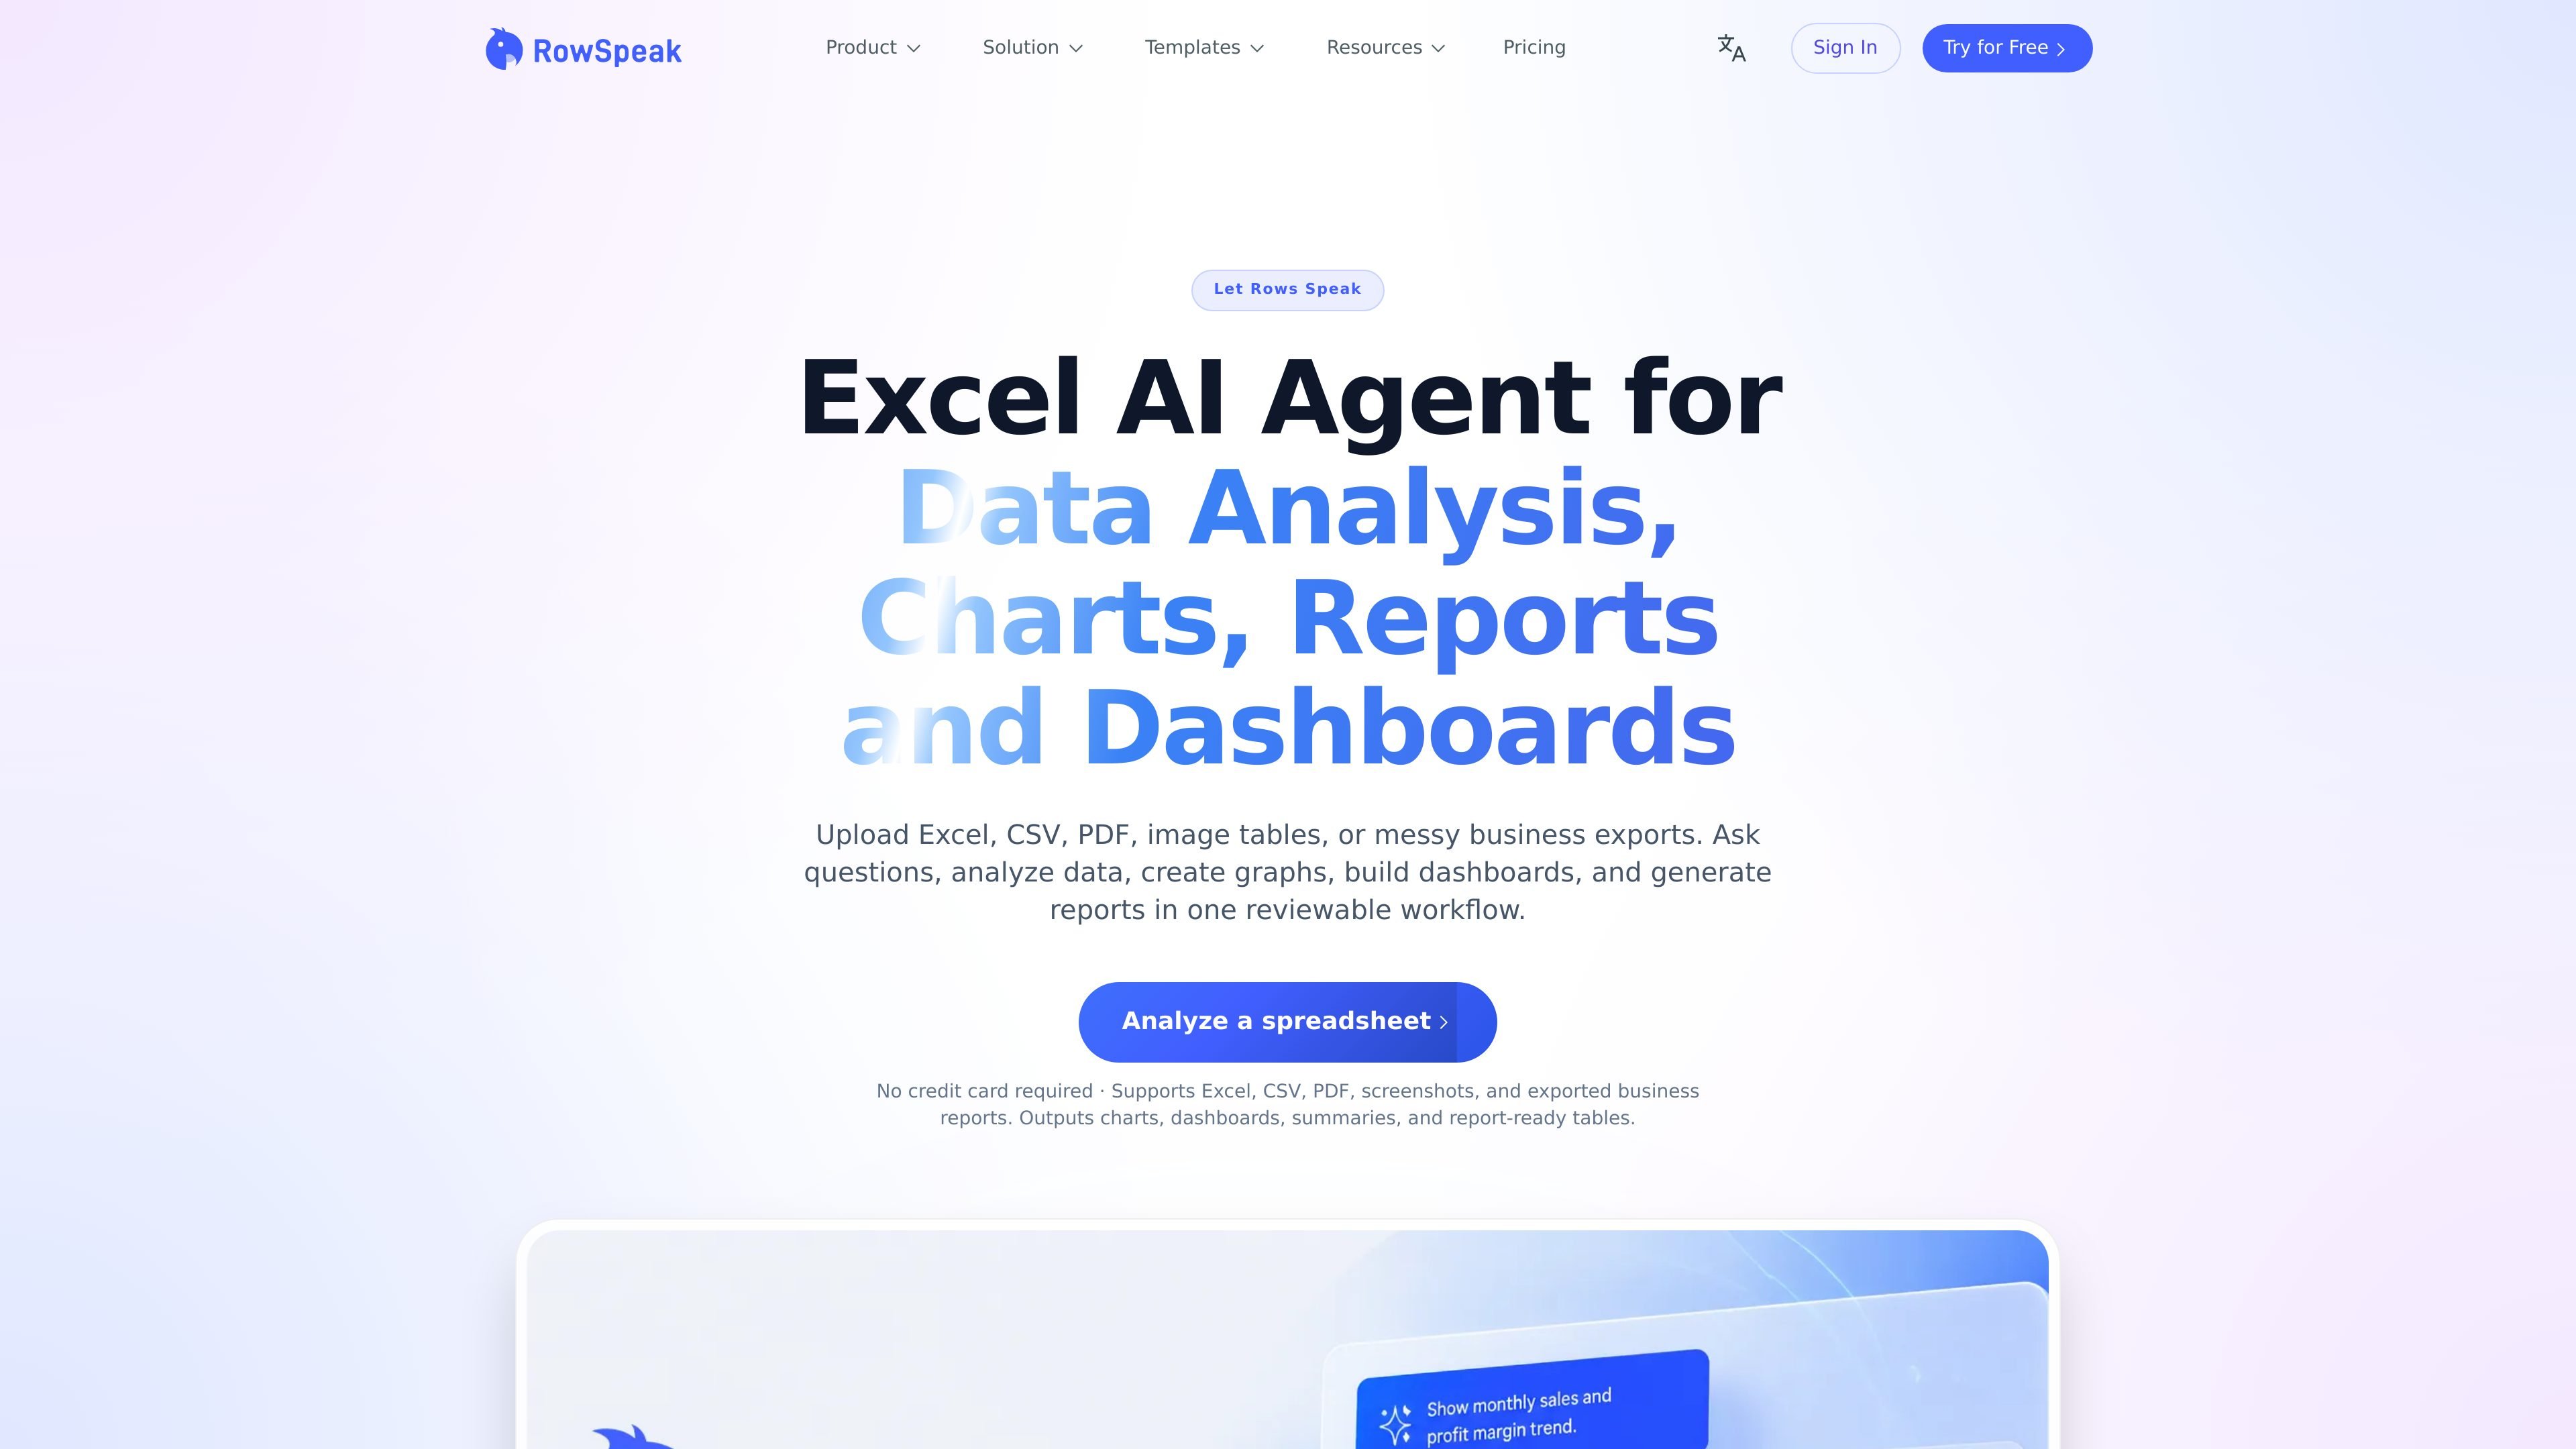

RowSpeak is a browser-based AI spreadsheet analysis tool for Excel, CSV, PDF tables, screenshots, and other business exports. It helps users turn messy files into charts, dashboards, summaries, and report-ready outputs they can review before sharing.


Template.net is an AI-powered editor for creating editable documents, presentations, designs, charts, whiteboards, and web assets from prompts or templates.

爱图表 is an AI-powered visual content platform for generating and deeply editing charts, infographics, and report visuals.


HaiSnap is an AI office and creation tool that turns natural language into PPTs, reports, data analysis, code and content drafts.

AiBiao.com is an AI chart generator for presentations, articles, teaching materials, and office documents from text, pasted data, or Excel uploads.
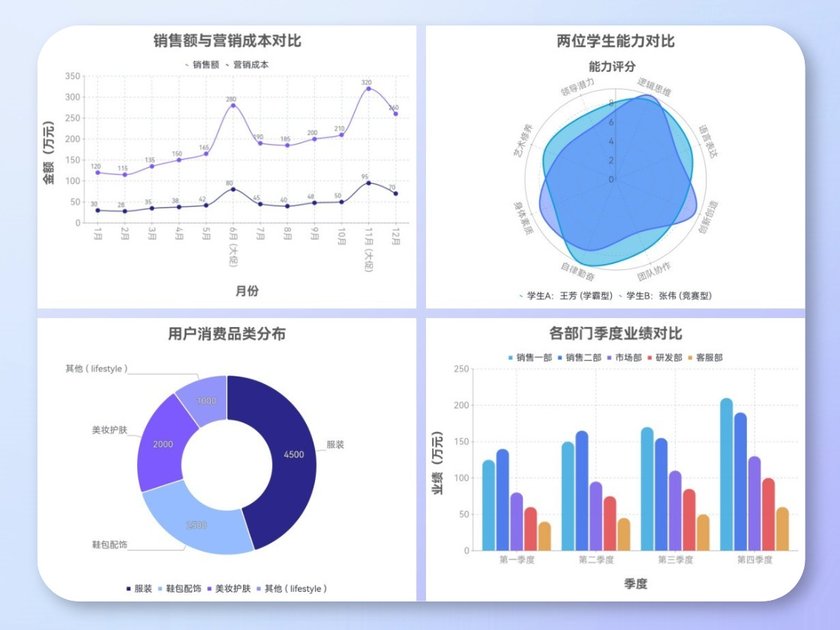

PicDoc 是一款面向科研、教育和办公场景的 AI 文本可视化工具,可将文本、文稿和数据转成图表、信息图、科研配图和 PPT 单页。它支持在线编辑与多格式导出,也提供免费方案和付费会员套餐。


北极九章 is an enterprise AI data insight engine for natural-language data analysis. Ask by typing or voice and get charted results in workflows.

AI Graph Maker is a web app for turning text or data into interactive charts, diagrams, mind maps, and flowcharts for reports, planning, and presentations.
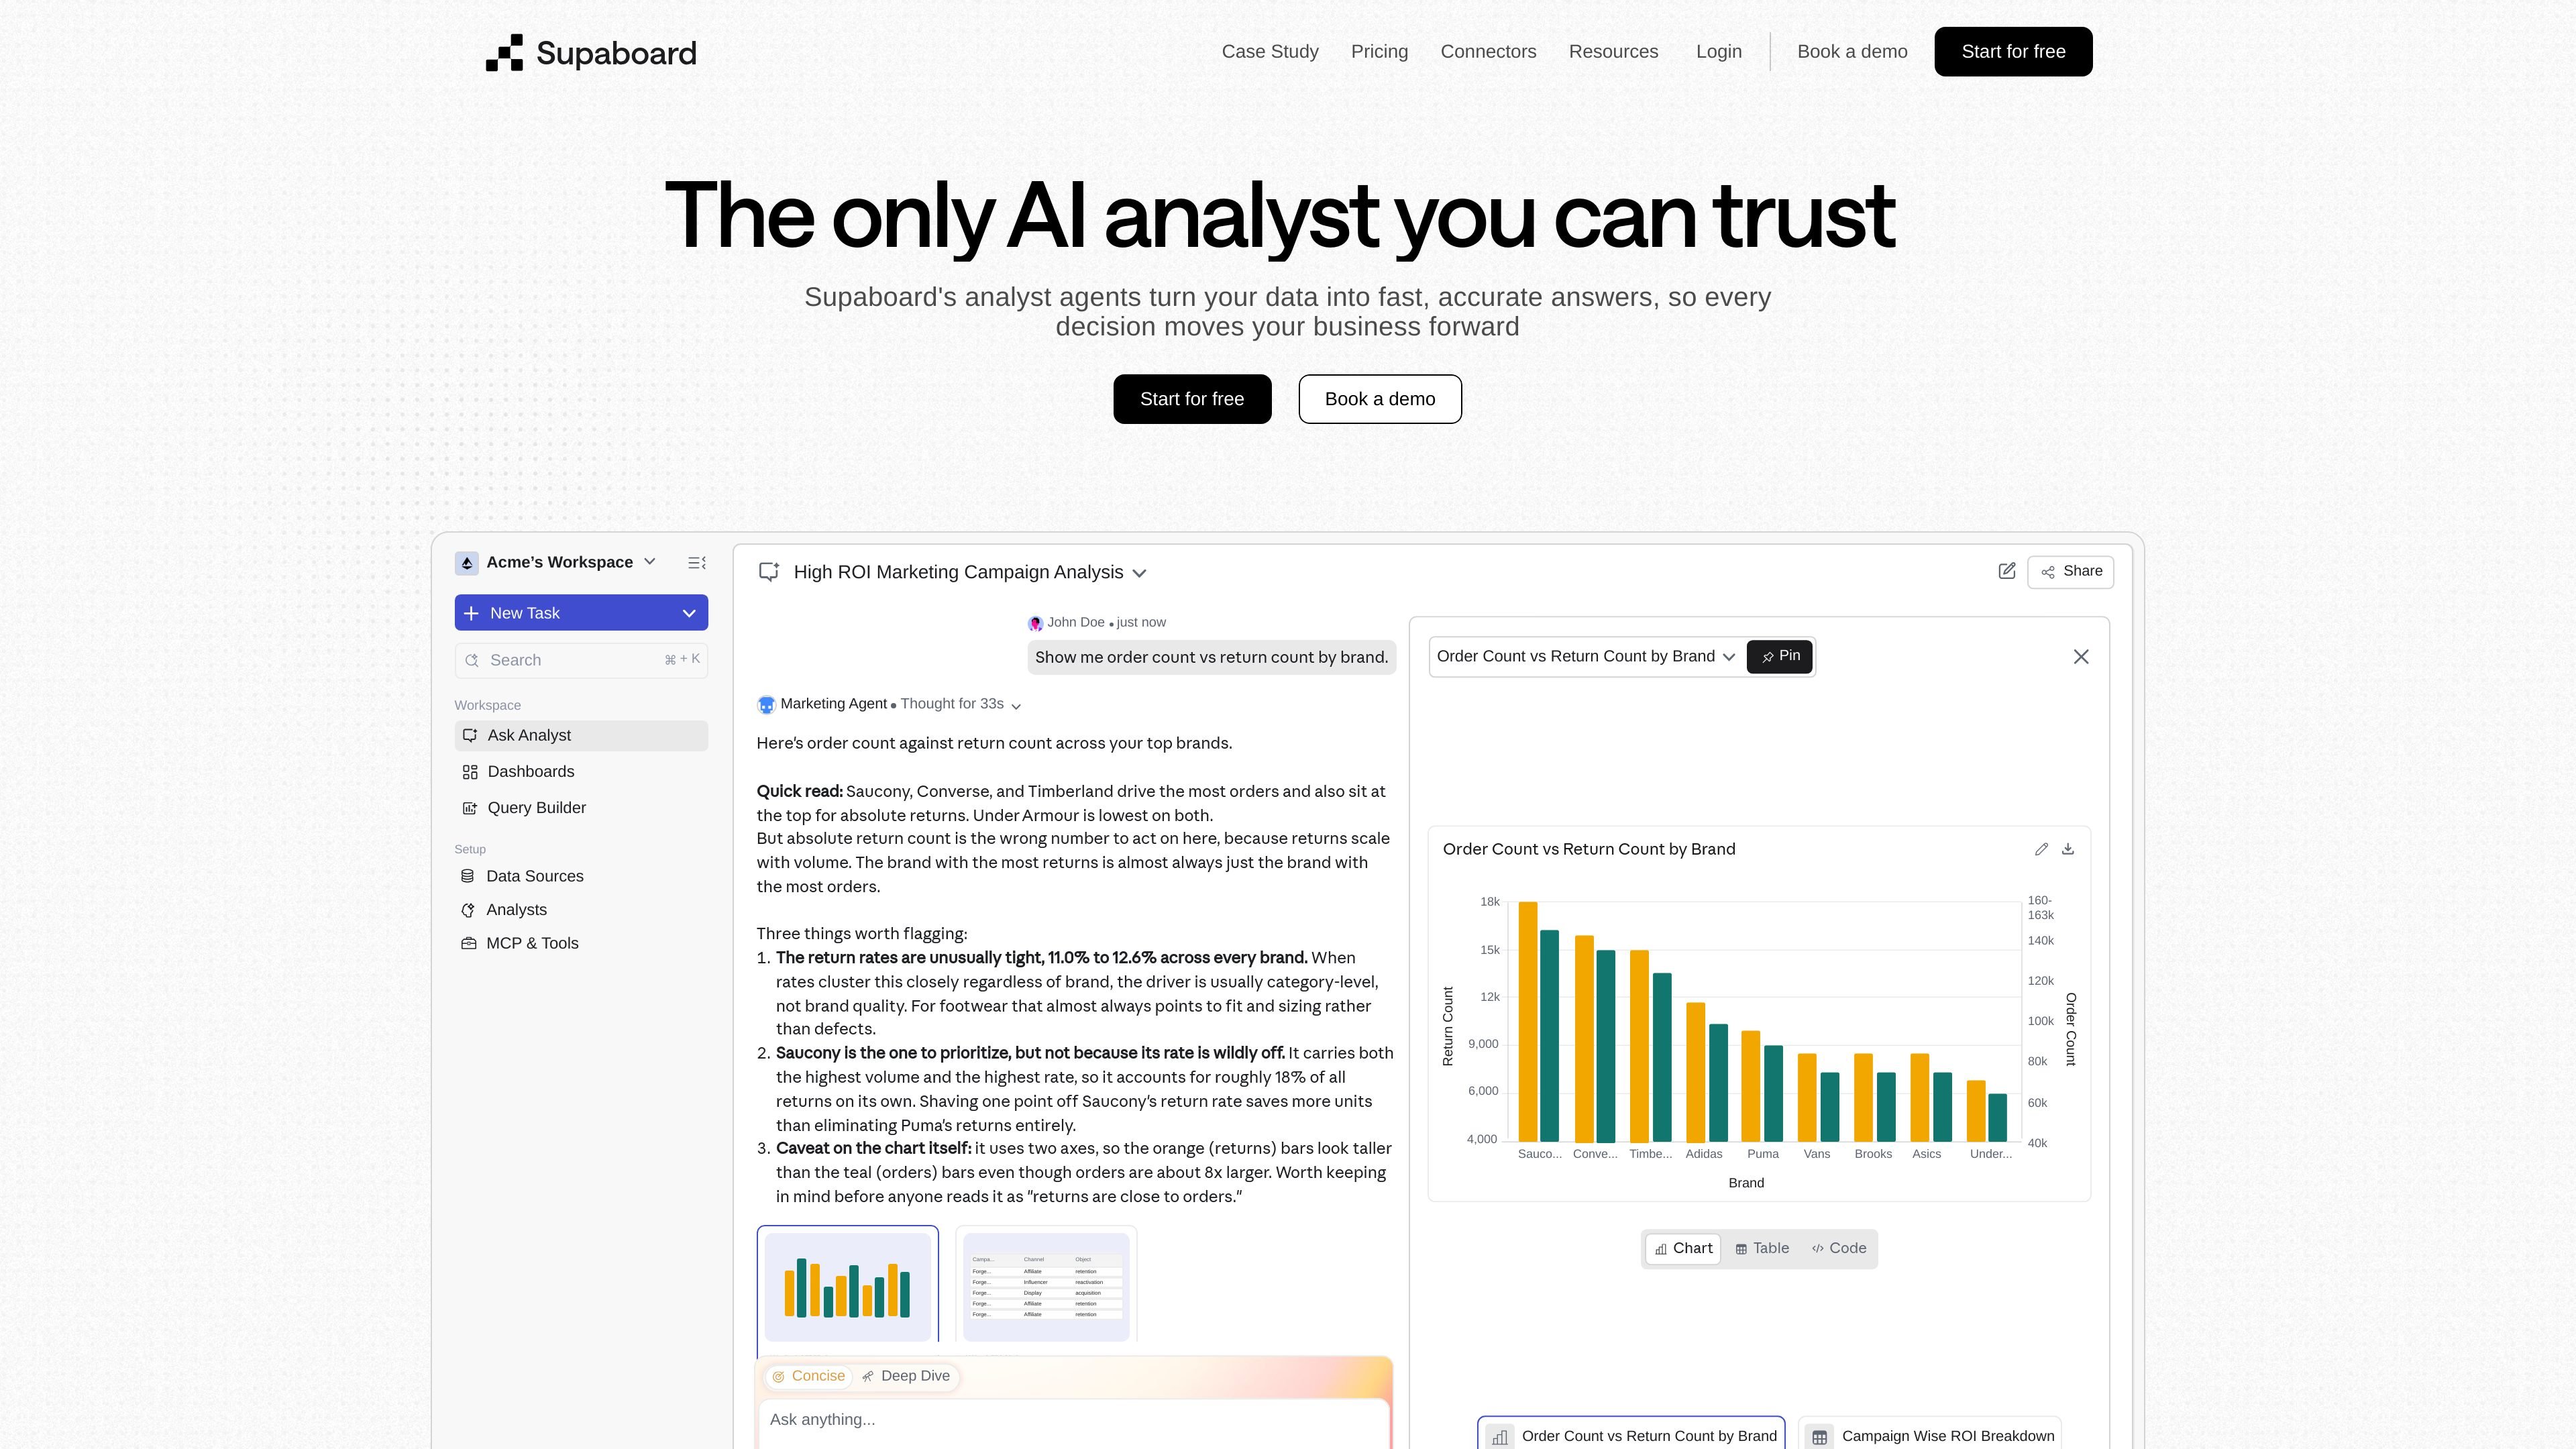

Supaboard is an AI business intelligence platform for connected data, natural-language questions, and SQL-assisted dashboards and insights.