
Create dashboards from common file formats
Upload CSV, XLSX, PDF, or PNG files and have Bricks generate dashboards and reports from the data.

Bricks is an AI data analyst that turns CSV, Excel, PDF, and PNG data into dashboards and reports, with editing and sharing options.
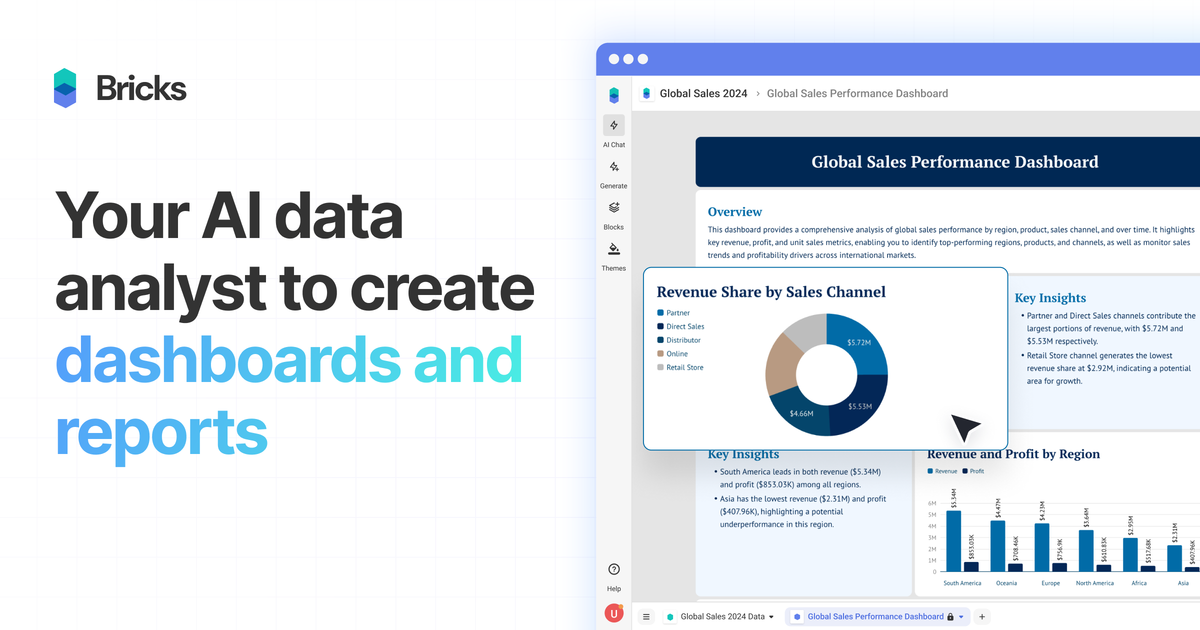
Bricks is an AI data analyst for turning spreadsheet-style data into dashboards and reports. The site positions it as a way to create polished visual outputs from CSV, Excel, PDF, and PNG files without building charts and layouts manually.
It is aimed at people who need usable dashboards quickly from everyday business data, including spreadsheets, CRM exports, sales reports, marketing data, financial data, surveys, and operational metrics. Bricks combines AI-generated analysis with manual editing controls, so users can start from an automated draft and refine it for a specific audience or presentation.
Upload CSV, XLSX, PDF, or PNG files and have Bricks generate dashboards and reports from the data.
Use AI to create dashboards, edit charts, add visualizations, generate insights, and customize reports through prompts.
Change layouts and visuals manually with drag-and-drop editing, data updates, color changes, and text edits.
Refresh a dashboard with new data and regenerate charts while keeping the existing layout in place.
Click data points to filter the dashboard and explore patterns across the full report.
Save dashboard layouts and reuse them with fresh data, rather than rebuilding from scratch.
Turn recurring spreadsheet or CRM exports into a dashboard that can be refreshed when new data arrives, reducing repetitive chart rebuilds.
Create dashboards for teams that need a clean view of sales, finance, operations, or performance data without manual design work.
Build report-style outputs for clients or stakeholders and export them to PDF or PPTX for sharing outside the product.
Start from a template, swap in new data, and reuse the same layout for similar reporting jobs across different datasets.
Review smaller analytical datasets such as survey results or operational metrics, then filter by data points to inspect trends and patterns.
Bricks is an AI data analyst that creates dashboards and reports from CSV, Excel, PDF, and PNG files. You upload your data, and Bricks generates charts, tables, insights, and a layout you can further edit.
The pricing page says Bricks offers Free, Premium, Pro, and Enterprise plans. Free includes 20 AI messages per month and supports teams of up to 3, while paid plans increase message limits, collaboration capacity, and support levels.
Yes. Bricks supports manual editing and AI-assisted changes after a dashboard is created. You can drag and drop tiles, update data, change colors, modify text, and use prompts to add or change charts and analysis.
Bricks can export dashboards or reports to PDF or PPTX. It also supports public share links and presenting directly within Bricks.
The source says Bricks is built for small to medium-sized datasets such as spreadsheet data, CRM exports, sales reports, marketing analytics, financial data, survey results, and operational metrics, typically under a few thousand rows.