Spreadsheet-style data entry
Upload or paste spreadsheet data, then edit rows and values directly in the browser to build charts without switching tools.
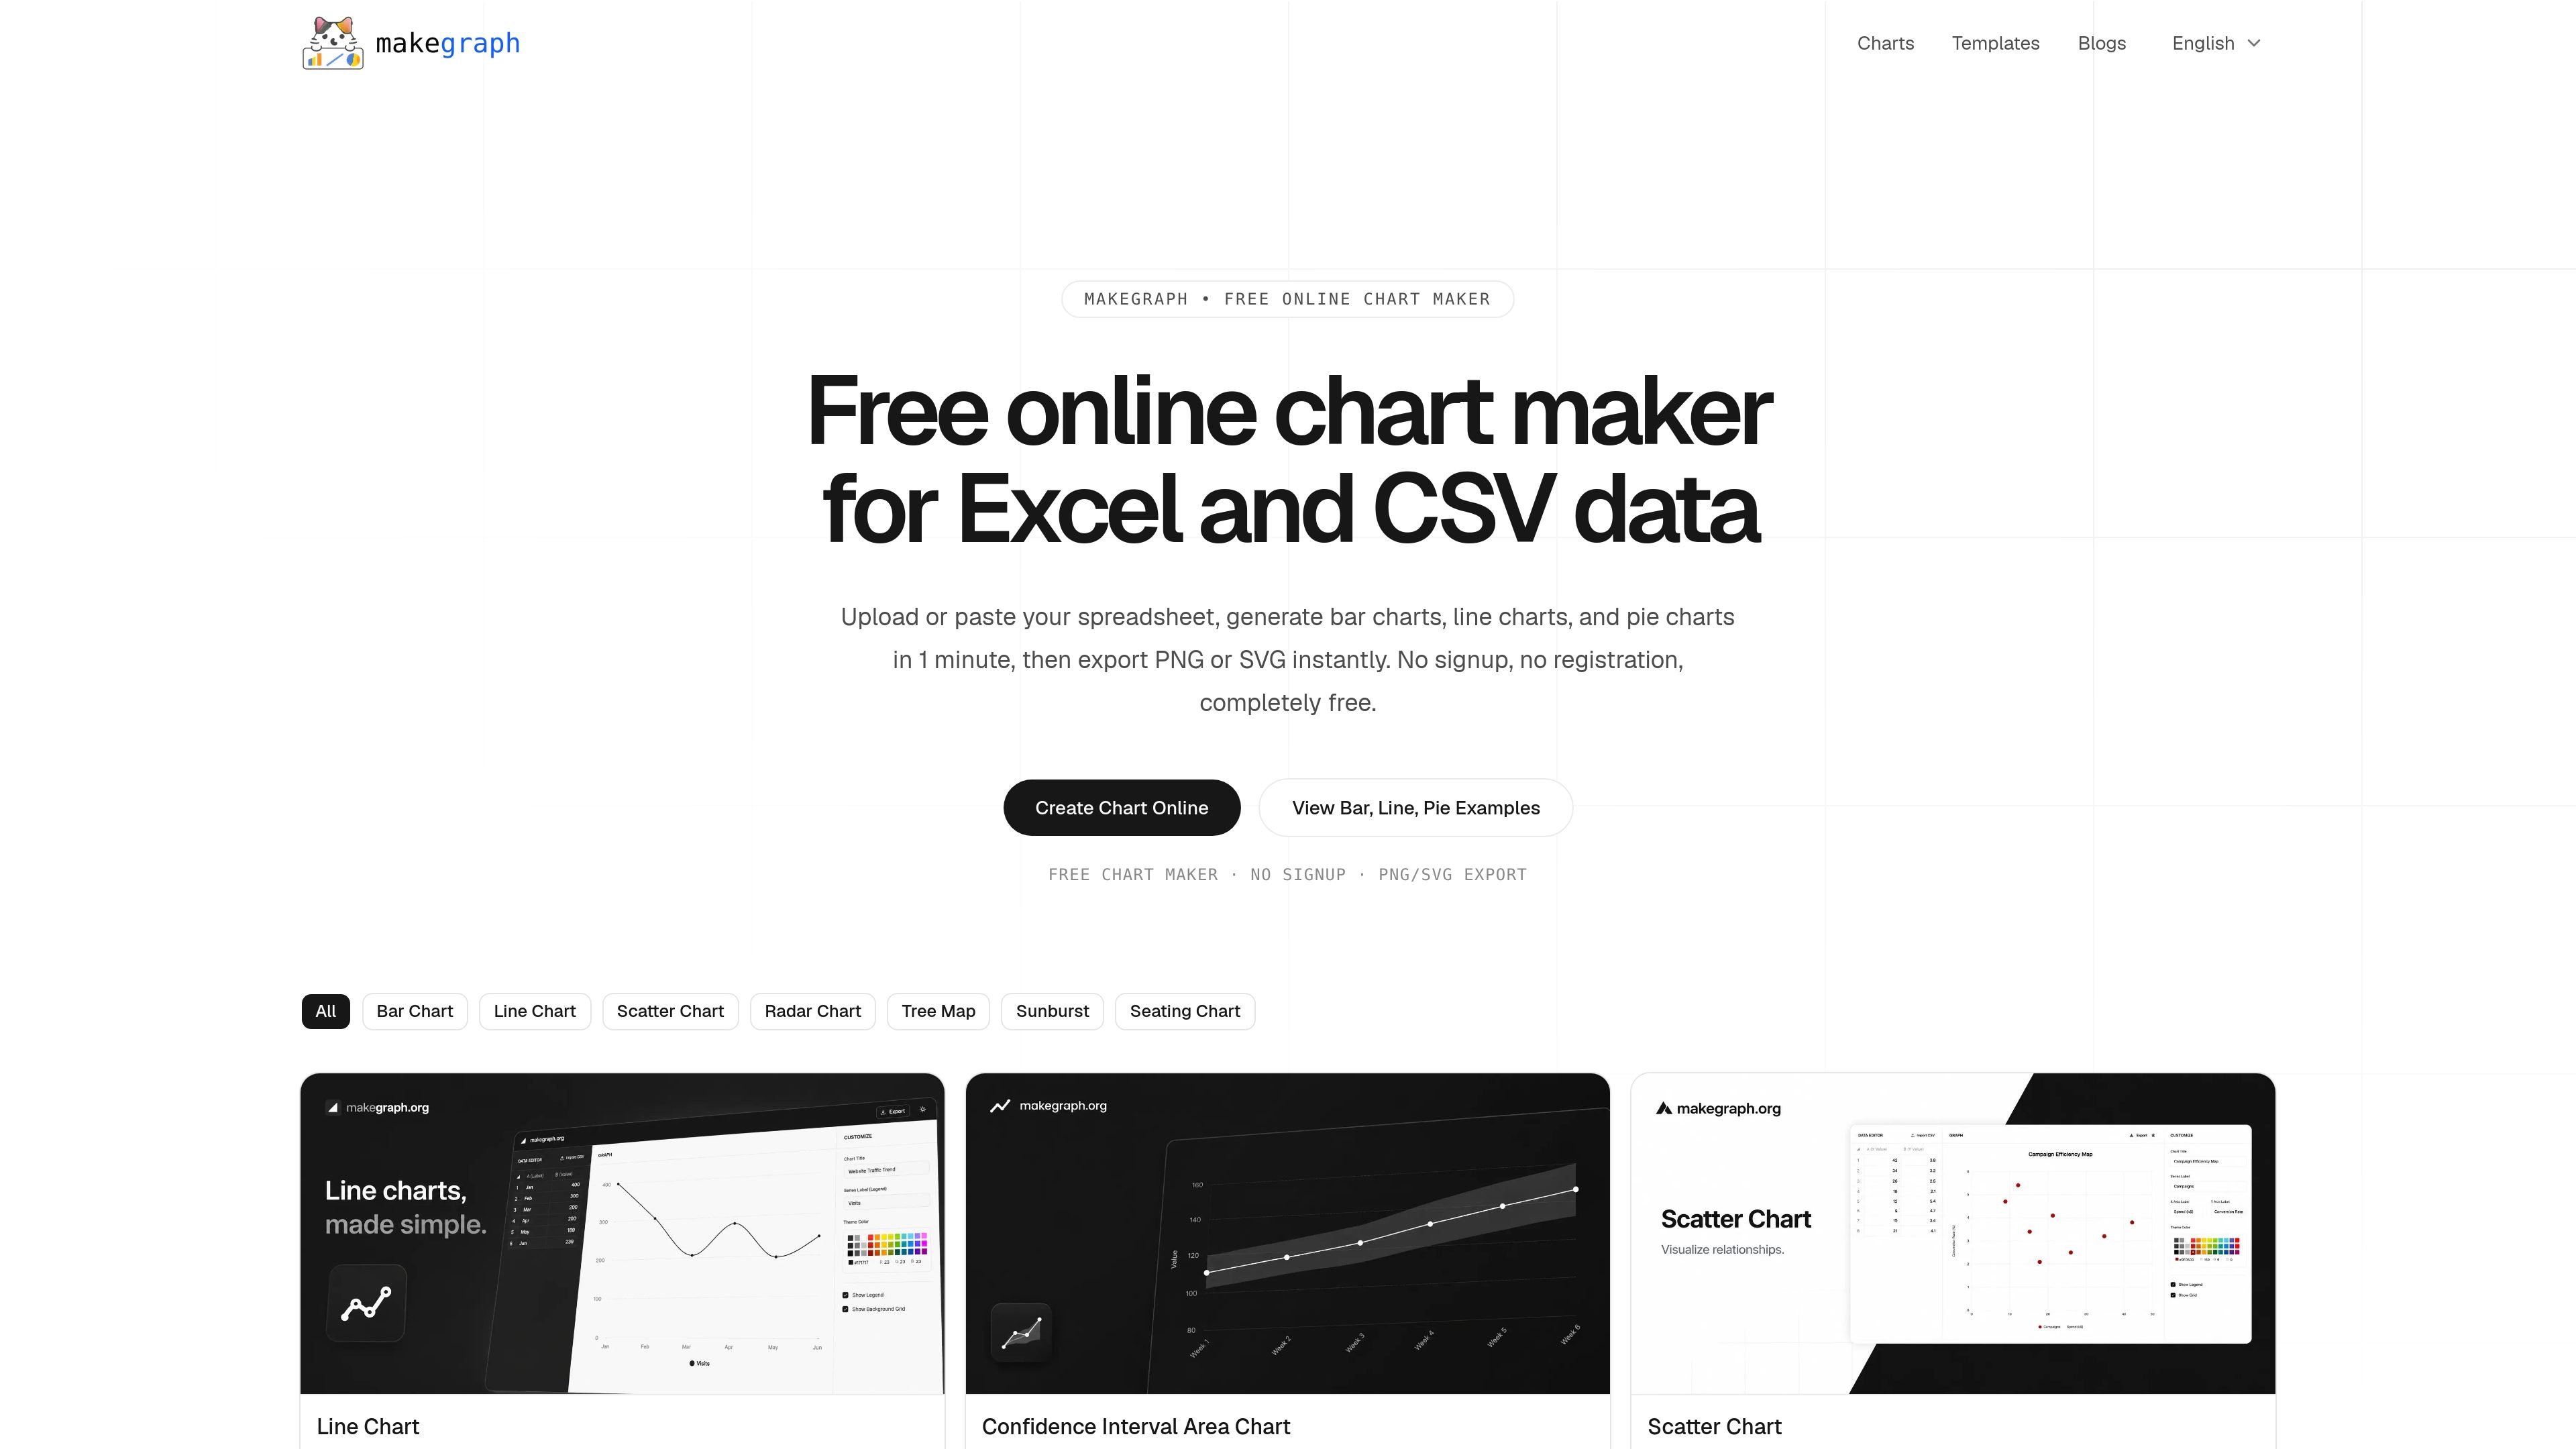
MakeGraph is a free online chart maker for spreadsheet data. It lets you upload or paste Excel or CSV content, turn it into charts in the browser, and preview changes as you edit.
The homepage emphasizes quick chart creation for bar, line, and pie charts, with additional chart pages for other chart types such as stacked bar charts, scatter charts, radar charts, treemaps, and sunburst charts. The editor is built around direct table editing and instant preview, then exports finished charts as PNG or SVG.
The product is positioned for people who need a lightweight way to create clean charts for reports, presentations, dashboards, and analysis without signing up or using a heavier spreadsheet workflow.
Upload or paste spreadsheet data, then edit rows and values directly in the browser to build charts without switching tools.
Preview chart updates as you edit, which helps you check labels, values, and layout before exporting.
Create bar, line, and pie charts from the homepage workflow, with additional chart pages for types such as stacked bar charts and other visualizations.
Adjust chart title, series labels, colors, legend visibility, and background grid from the chart editor.
Export finished charts as PNG or SVG for reuse in reports, slides, or shared documents.
Use the editor on desktop or mobile, with a three-column layout on larger screens and bottom-sheet controls on smaller devices.
Turn category-based numbers into bar charts for sales, survey results, channel performance, or ranked comparisons.
Plot values over time with line charts to show trends, peaks, dips, and changes in direction for metrics such as traffic or revenue.
Use stacked bar charts to compare totals and composition across groups, including category mix or survey breakdowns.
Create quick charts for slides, reports, or dashboards when you need a clean visual without leaving the browser or using a spreadsheet chart tool.
Build charts on desktop or mobile when you need to edit values, check the preview, and export the result from a lightweight online workflow.
It is best for turning spreadsheet-style data into clear charts without leaving the browser, especially when you want to preview results quickly and export them as PNG or SVG.
The source pages show chart makers for bar charts, line charts, stacked bar charts, and other chart types such as scatter, radar, treemap, and sunburst charts.
Yes. The site states that you can upload or paste Excel or CSV data, edit values in a built-in table, and generate charts from that input.
The site says charts can be exported instantly as PNG or SVG.
The homepage says no signup, no registration, and that the product is completely free. The pricing URL in the provided sources returns a 404, so no paid plan details are available from the evidence here.
GPTExcel is an AI spreadsheet assistant for generating formulas, SQL queries, automation scripts, regex patterns, and table templates across Excel, Google Sheets, LibreOffice Calc, and Airtable. It also supports file chat, image-to-table conversion, charts, and spreadsheet data analysis.
OpenAI Agents SDK 是一款輕量級的 JavaScript/TypeScript 框架,可用於建立多代理工作流程與語音代理,支援 sandboxed agents、handoffs、tools、tracing 與 realtime agent 模式。
Lollipop 是一款面向求職者的 AI 面試官工具,提供語音模擬面試、JD 解析、簡歷潤色與結構化評估報告,適合面試前練習、自我評估與投遞準備。
LiteLLM 以相容 OpenAI 的方式,透過 Python SDK 或 proxy server 管理並呼叫 100+ 個 LLM,協助團隊以單一介面路由請求、追蹤支出並串接多家供應商。
Langfuse 是一款開源 AI 工程平台,專為追蹤、評估與優化 LLM 應用和代理而設計,整合可觀測性、提示管理、實驗與人工標註,讓團隊以實際使用資料串接完整工作流程。
ImagePackAI 是一款網頁版 AI 圖像生成器,可依文字提示或參考圖片生成圖片,支援第三方模型與一次性點數包,並可在下載前調整關鍵生成設定。