
Multi-format source input
Create interactive visuals from PDFs, Word files, PowerPoint files, spreadsheets, images, webpages, YouTube links, long text, and URL-based sources.

MyLens is an AI workspace that turns files, links, and data into interactive visuals and diagrams. It helps people summarize dense content, explore sources, and present information in formats such as mind maps, timelines, and flowcharts.
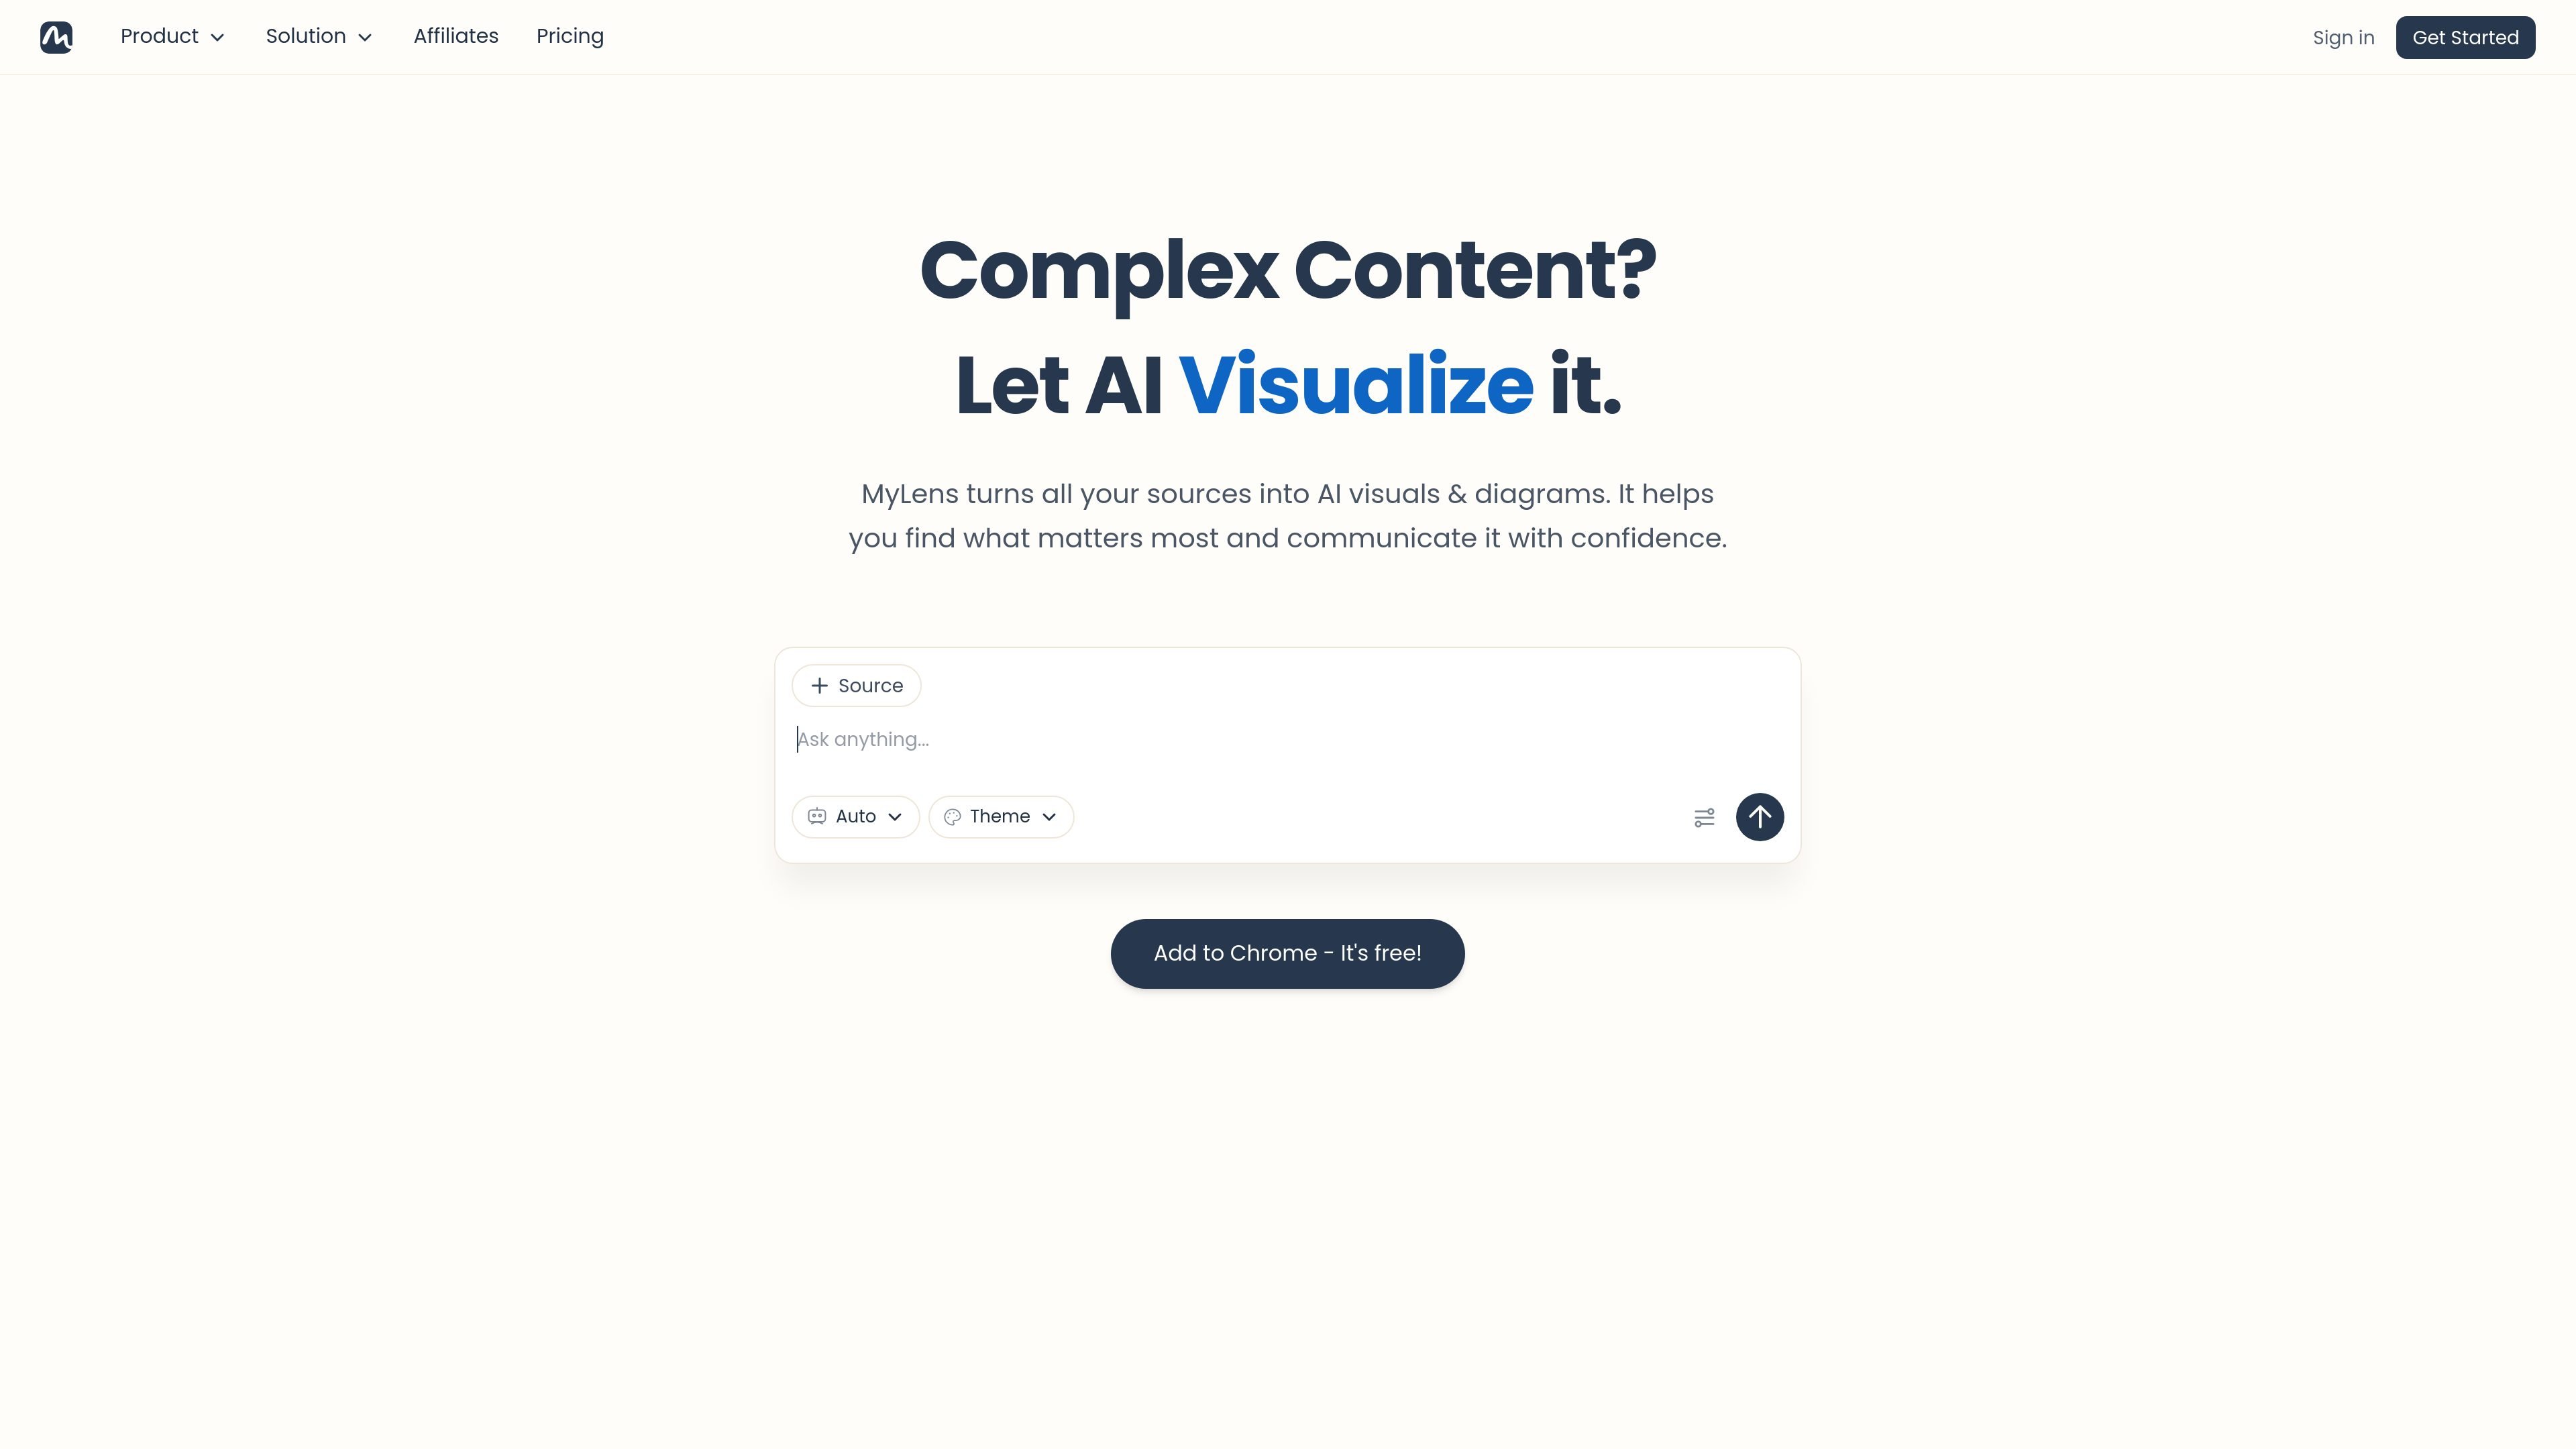
MyLens is an AI workspace for turning content and data into interactive visuals and diagrams. It accepts many source types, including text, PDFs, Word documents, PowerPoint files, spreadsheets, images, webpages, YouTube links, and URLs, then converts them into visuals such as timelines, flowcharts, mind maps, charts, and diagrams.
The product is built around exploratory visuals rather than static outputs. Users can click through sections, drill into details, and trace insights back to the original source, which makes it suited to reading dense material, summarizing documents, and presenting findings in a more structured format.
Create interactive visuals from PDFs, Word files, PowerPoint files, spreadsheets, images, webpages, YouTube links, long text, and URL-based sources.
Move beyond static charts by clicking, expanding, and drilling into visuals to explore content in layers.
Trace insights back to the original source so the output stays verifiable and easier to trust.
Adjust content, colors, fonts, and layouts before sharing or presenting the result.
Use the browser extension to turn webpages, dashboards, articles, or online portals into visual summaries without leaving the browser.
Work with different visualization forms, including timelines, flowcharts, mind maps, charts, diagrams, tree diagrams, quadrants, tables, and visual summaries.
Upload reports, research papers, or long briefs and turn them into explorable visuals that highlight the main points and supporting structure.
Import CSV or Excel files and use interactive charts and diagrams to surface patterns, trends, and relationships in the data.
Convert Word documents, proposals, or meeting notes into editable flowcharts, mind maps, or tables for clearer review and presentation.
Paste a webpage, article, or YouTube link to produce a visual summary that is easier to scan than the original source.
Use the browser extension to visualize dashboards, news, social posts, or private portals directly from the browser.
MyLens AI takes uploaded files, links, pasted text, images, spreadsheets, and videos, then turns them into interactive visuals such as mind maps, timelines, flowcharts, charts, and diagrams.
Yes. The source pages say MyLens visuals are fully interactive, and you can edit, refine, customize, share, export, or embed them depending on the page and plan.
Yes. The source pages say you can present visuals inside MyLens, download high-quality versions, or embed interactive visuals into websites and documents.
Yes. MyLens offers a Chrome extension that can transform webpages and online content into visual summaries or diagrams from the browser.
Yes. The pricing page shows a free plan, and the product pages state you can get started for free.