
Modular visualization suite
VisActor combines several modules rather than a single charting tool, including a rendering engine, visualization grammar, charting, table, GIS, graph visualization, data analysis, and surrounding ecosystem components.

VisActor is a modular data visualization platform for charts, tables, rendering, and intelligent visualization tools, built for dashboards and narrative data experiences.
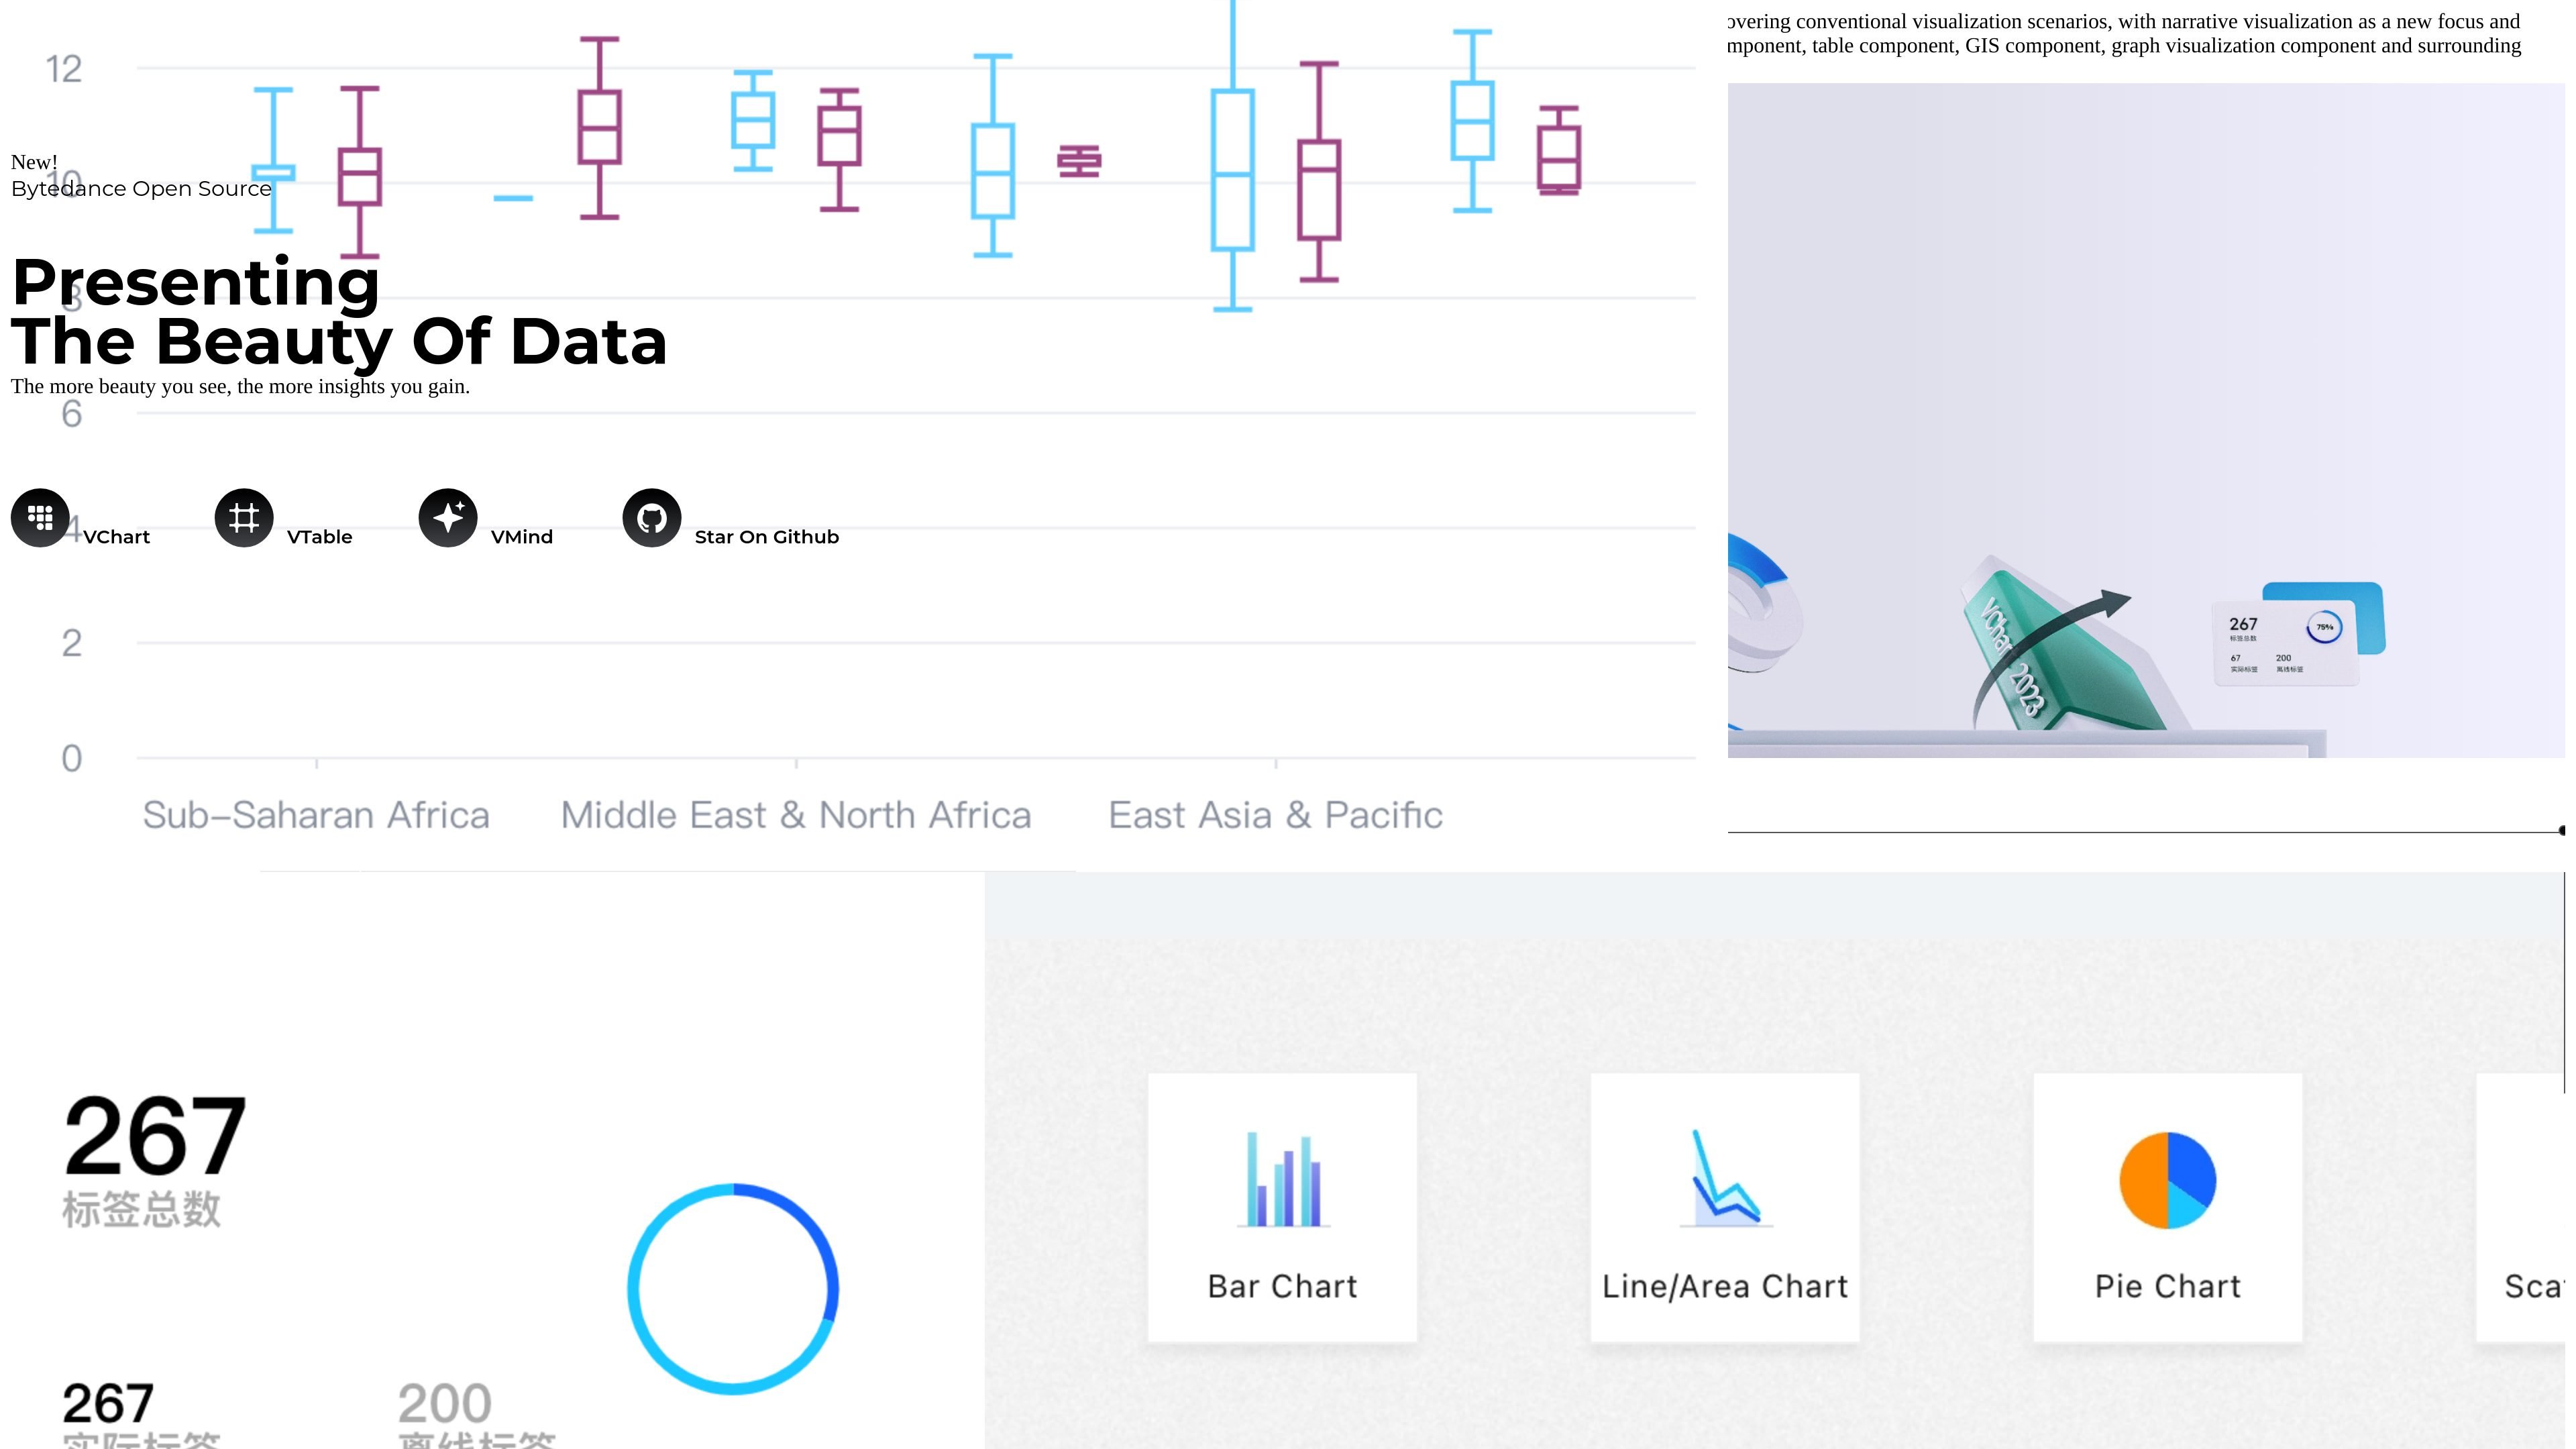
VisActor is a narrative-oriented intelligent visualization solution built from a range of visualization scenarios at ByteDance. It is positioned as a modular platform that covers conventional visualization needs while focusing on narrative visualization and intelligent visualization as its main direction.
The site presents VisActor as a family of related products and capabilities, including rendering, visualization grammar, charting, table analysis, GIS, graph visualization, and supporting tools. The public pages highlight modules such as VChart, VTable, VMind, VGrammar, VRender, VStory, and VSeed, showing that the platform is designed as an ecosystem rather than a single standalone component.
VisActor combines several modules rather than a single charting tool, including a rendering engine, visualization grammar, charting, table, GIS, graph visualization, data analysis, and surrounding ecosystem components.
The platform emphasizes narrative visualization and intelligent visualization, positioning data presentation around story-driven and assisted workflows instead of only standard charts.
VChart supports out-of-the-box multi-terminal charting and covers common 2D and 3D chart types based on existing business experience.
VTable is built on Canvas and is designed to handle large data volumes with stronger rendering and interaction performance than traditional DOM tables.
VMind provides intelligent visualization interfaces using rule algorithms, machine learning, and LLM-based capabilities for recommendations, color matching, and code assistance.
The product pages describe supported products such as Volcano Engine, Lark, TikTok, CapCut, and Medium Observable, indicating use across several connected ecosystems.
Use VChart when you need a general-purpose charting library for statistical dashboards, business reports, or front-end applications that must render across desktop, web, mobile web, and mini-program environments.
Use VTable for large, multi-dimensional datasets where interactive analysis, perspective views, tree display, and smooth rendering matter more than a basic spreadsheet-style table.
Use VMind when a team wants intelligent assistance for visualization, such as recommended chart choices, color matching, or generated code to speed up data presentation work.
Use the broader VisActor suite when a product needs both conventional visualization components and narrative or story-driven presentation layers within the same ecosystem.
Use the platform for large screens, BI dashboards, or office-suite style environments where the site specifically calls out rich chart types, animation effects, dynamic data updates, and compatibility across end environments.
VisActor is presented as a narrative-oriented intelligent visualization solution made up of multiple modules, including VChart, VTable, VGrammar, VRender, VMind, VStory, and VSeed.
The site highlights conventional visualization scenarios, with narrative visualization as a new focus and intelligent visualization as the goal.
The pricing page does not show a published price in the provided source text. The available evidence only confirms that the site has a dedicated pricing page.
The source text shows supported products and contact links, but it does not provide a complete integration list or setup workflow details.
VisActor has separate product pages for its modules, including VChart for charts, VTable for tables, and VMind for intelligent visualization.