
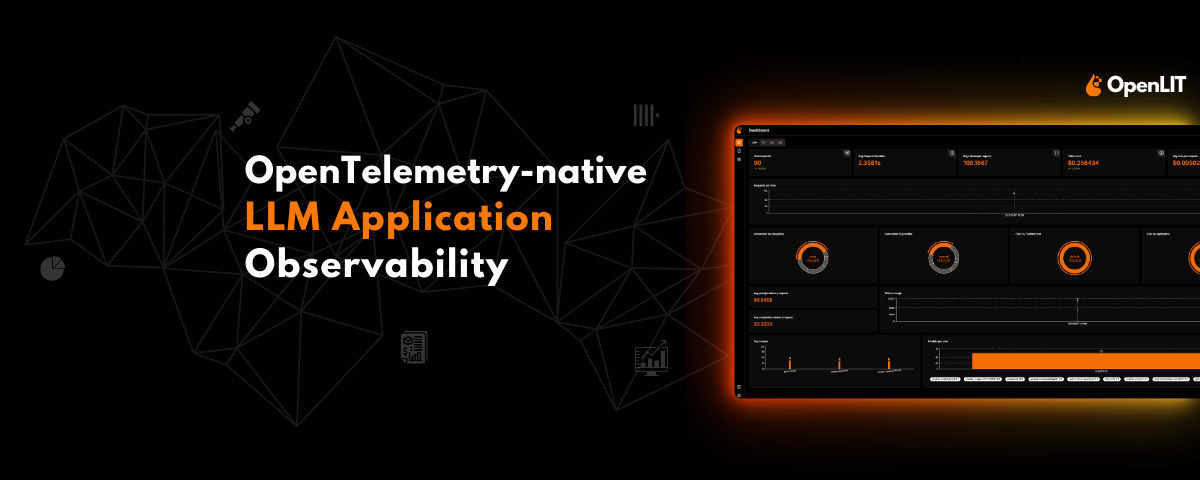
Distributed tracing
Monitor and trace LLM applications in real time with OpenTelemetry-powered distributed tracing. The site says this helps visualize request flows, identify bottlenecks, and follow the lifecycle of each AI interaction.

Open-source LLM observability with OpenTelemetry for monitoring, tracing, and evaluating AI apps.
OpenLIT is an open-source platform for AI engineering focused on LLM observability, tracing, and evaluation. It is built on OpenTelemetry and is positioned for production workloads that need monitoring across AI applications, prompts, models, and surrounding infrastructure.
The product is designed to work with existing SDK-based applications and observability stacks. The homepage emphasizes quick setup with a few lines of code, while the pricing page states the self-hosted edition is Apache 2.0 licensed, free forever, and available without usage limits or license keys.
Monitor and trace LLM applications in real time with OpenTelemetry-powered distributed tracing. The site says this helps visualize request flows, identify bottlenecks, and follow the lifecycle of each AI interaction.
Run online and offline evaluations either from the UI or through SDKs. The product positioning ties evaluation to prompts, models, and end-to-end application testing.
Centrally manage prompts with versioning and deployment controls. OpenLIT presents this as a way to experiment with prompt variations and track prompt performance over time.
Inspect telemetry across deployments with real-time dashboards and custom SQL queries. The homepage also mentions configurable widgets and layouts for visualizing OpenTelemetry data.
Manage multiple deployments from one view. OpenLIT describes Fleet Hub as a way to compare performance metrics across environments and coordinate an AI fleet from a single dashboard.
Track infrastructure signals alongside LLM activity, including GPU monitoring, vector database tracing, token usage, and cost tracking. The pricing page also mentions exports to Grafana, Datadog, and any OTLP backend.
Instrument an existing LLM application directly in the SDK and capture traces, token usage, and cost data without routing traffic through a proxy. This fits teams that want observability with minimal code changes and no added proxy latency.
Run prompt and model experiments in the UI or through SDKs, then use evaluations to compare outputs and iterate on application behavior. OpenLIT also includes prompt versioning so teams can track changes over time.
Monitor self-hosted or distributed AI infrastructure where GPU utilization, VRAM, temperature, and power draw matter. The comparison pages specifically call out NVIDIA and AMD GPU monitoring and vector DB tracing.
Manage several AI deployments from a single dashboard and compare performance across environments. Fleet Hub is presented as a multi-deployment view for teams operating more than one application or environment.
Export telemetry to existing observability tools such as Grafana, Datadog, or any OTLP-compatible backend. This suits teams that already have a standard monitoring stack and want to keep data flowing there.
Yes. OpenLIT is Apache 2.0 licensed and free to self-host, with no usage limits, no feature gates, and no license key required.
The pricing page says Docker and Docker Compose are enough to self-host. It also says you can run `docker compose up -d` in the repo to start the full stack, including the UI, ClickHouse storage, and OpenTelemetry Collector.
Yes. OpenLIT is OpenTelemetry-native and can export to OTLP-compatible backends such as Grafana, Datadog, New Relic, SigNoz, and Jaeger.
Yes. The pricing page says GPU metrics can be enabled with `openlit.init(collect_gpu_stats=True)`, and that OpenLIT collects utilization, VRAM usage, temperature, and power draw from NVIDIA and AMD GPUs.
A managed cloud service is listed as coming soon. The page says the Cloud tier is in development and invites users to join the waitlist by emailing [email protected].
Traffic data is for reference only.

helicone.ai
AI gateway and LLM observability platform for routing, debugging, analysis, and management

apipark.com
Open-source API portal and AI gateway for APIs and production LLMs

aakar-ai.dev
Manage AI providers, project setups, logs, and analytics in one dashboard with BYOK support.

evlat.kalaomer.com
Evlat is a quiet macOS status strip for monitoring Claude Code, Codex, and Antigravity sessions, plus long-running commands. It highlights sessions that need your response and shows activity from local or SSH-connected machines.

ddshub.cc
DDS Hub is an AI API platform for Claude and OpenAI-family workflows, offering token-based pricing, model selection, and Claude Code setup guidance.

groq.com
Fast, low-cost AI inference with Groq LPU and GroqCloud