
Local metered-traffic proxy
Routes supported LLM API calls through localhost and writes local event records for the traffic the proxy observes.

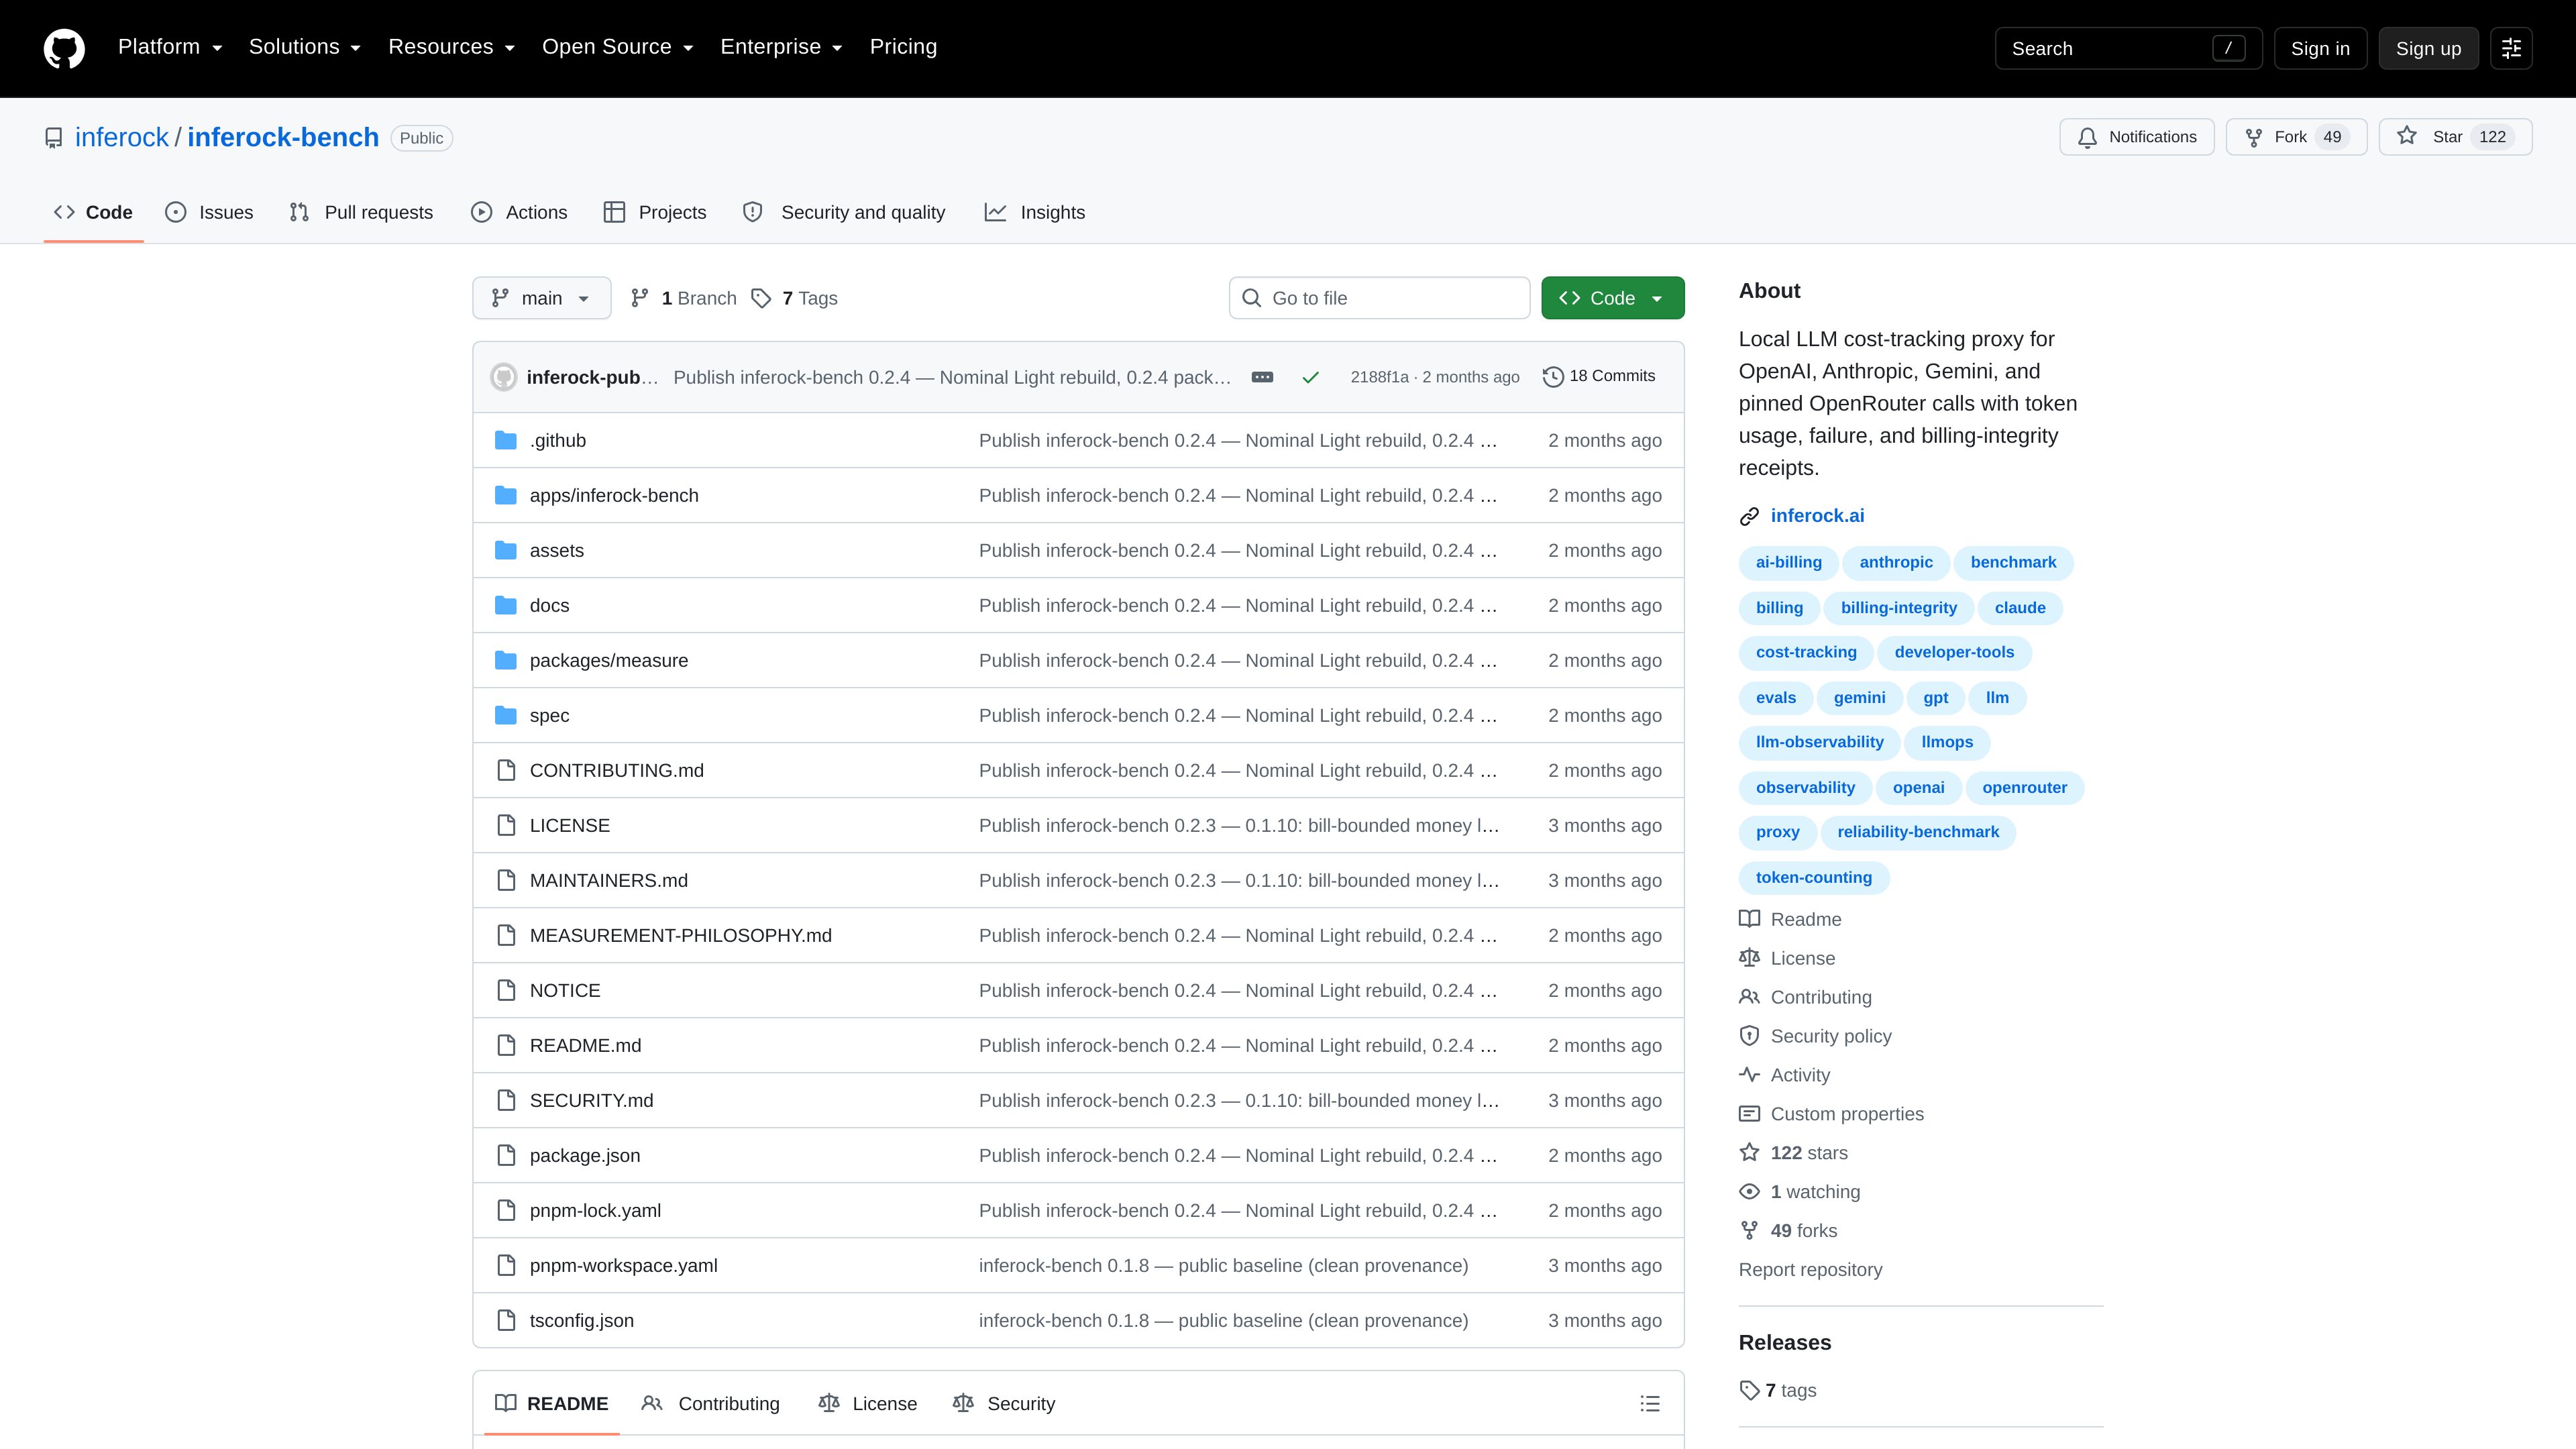
inferock-bench is a local diagnostic proxy for tracking LLM API usage, provider-reported costs, failures, and billing-integrity signals. It helps developers inspect calls to OpenAI, Anthropic, Gemini Developer API, and pinned OpenRouter endpoints using locally stored receipts.
inferock-bench is a local diagnostic proxy for metered LLM API traffic. It routes calls through localhost, records event data, and produces local receipts that compare provider-reported usage, pricing evidence, delivery outcomes, and billing-integrity signals.
The project is designed for investigating token usage, API failures, and questions about whether unsuccessful calls may still affect a bill. Its measured provider planes include OpenAI, Anthropic, Gemini Developer API, and pinned OpenRouter endpoints. Receipts distinguish observed facts from calculated interpretations and show when a check was not openable rather than treating it as clean.
The proxy only covers calls it actually sees. It is not a complete invoice audit, a provider-spend cap, or evidence about traffic that bypasses localhost.
Routes supported LLM API calls through localhost and writes local event records for the traffic the proxy observes.
Captures provider-reported token counts, pricing evidence, request and response metadata, status, timing, and retry evidence.
Surfaces signals including billed-empty output, refusals, truncation, token-recount mismatches, duplicate request IDs, cache-discount-at-risk evidence, and provider-fault retries.
Marks each surface as watched-clean, signal, or not-openable, making unopened checks visible instead of implying that they passed.
Renders receipts from stored event records using the shipped @inferock/measure grading code and a stamped grading version.
Supports measured planes for OpenAI, Anthropic, Gemini Developer API, and pinned OpenRouter endpoints spanning selected model families and observed hosts.
Route calls locally and compare observed provider usage and pricing evidence with a matching invoice when reviewing unexpected charges.
Use delivery and retry signals to investigate whether refusals, empty output, truncation, or provider faults occurred on calls that may still have billing consequences.
Inspect provider-reported token counts and request metadata for supported OpenAI, Anthropic, Gemini, or pinned OpenRouter traffic during development and testing.
Use receipt categories for provider spend, bill-bounded money loss, time loss, and invoice-check exposure without combining unlike measurements into one headline.
For calls routed through its local proxy, it records provider-reported usage, pricing evidence, request and response metadata, status, timing, retry evidence, and detector signals.
The repository identifies four measured provider planes: OpenAI, Anthropic, Gemini Developer API, and pinned OpenRouter endpoints covering selected models and observed hosts. Other coverage is described as extensible, not as measured today.
The source states that provider keys are not sent to Inferock by the local benchmark. The proxy attaches keys to provider requests, and receipts are local unless the user chooses to share them.
No. It cannot observe traffic that bypasses the proxy, cap spending across unseen calls, or explain a monthly bill without the matching invoice. Its dollar figures are calculations from observed events under published assumptions.
Receipts expose a not-openable coverage state instead of presenting an unopened check as clean. This distinguishes observed results from unavailable evidence.
Traffic data is for reference only.

www.tensorzero.com
TensorZero is an open-source LLMOps platform for building and operating production-grade LLM applications. Its stated scope combines an LLM gateway with observability, evaluation, optimization, and experimentation tools.

pydantic.dev
An AI engineering stack for type-safe apps, observability, evaluation, and model routing

www.lyzr.ai
OpenController is Lyzr’s control plane for discovering, evaluating, governing, and monitoring AI agents, models, tools, data, and workflows across an enterprise AI estate. It is intended for teams managing agents across clouds, frameworks, runtimes, and environments.

portkey.ai
Production AI platform with gateway, observability, guardrails, and prompt management for Gen AI teams.

konghq.com
Kong AI Gateway centralizes governance for LLM, MCP, and agent-to-agent traffic, helping platform and AI teams secure, observe, route, and control costs for production AI workloads.
www.langchain.com
LangSmith is an observability and evaluation platform for AI agents and LLM applications. It helps development and production teams trace agent behavior, monitor quality and cost, investigate failures, and evaluate changes.