
Natural-language chart generation
Describe a project in plain English and the system generates tasks, timelines, dependencies, and milestones automatically.

GanttChart.AI is a web-based AI project planning tool that turns plain-language project descriptions into Gantt charts. Edit in-browser and export to spreadsheet-friendly formats.
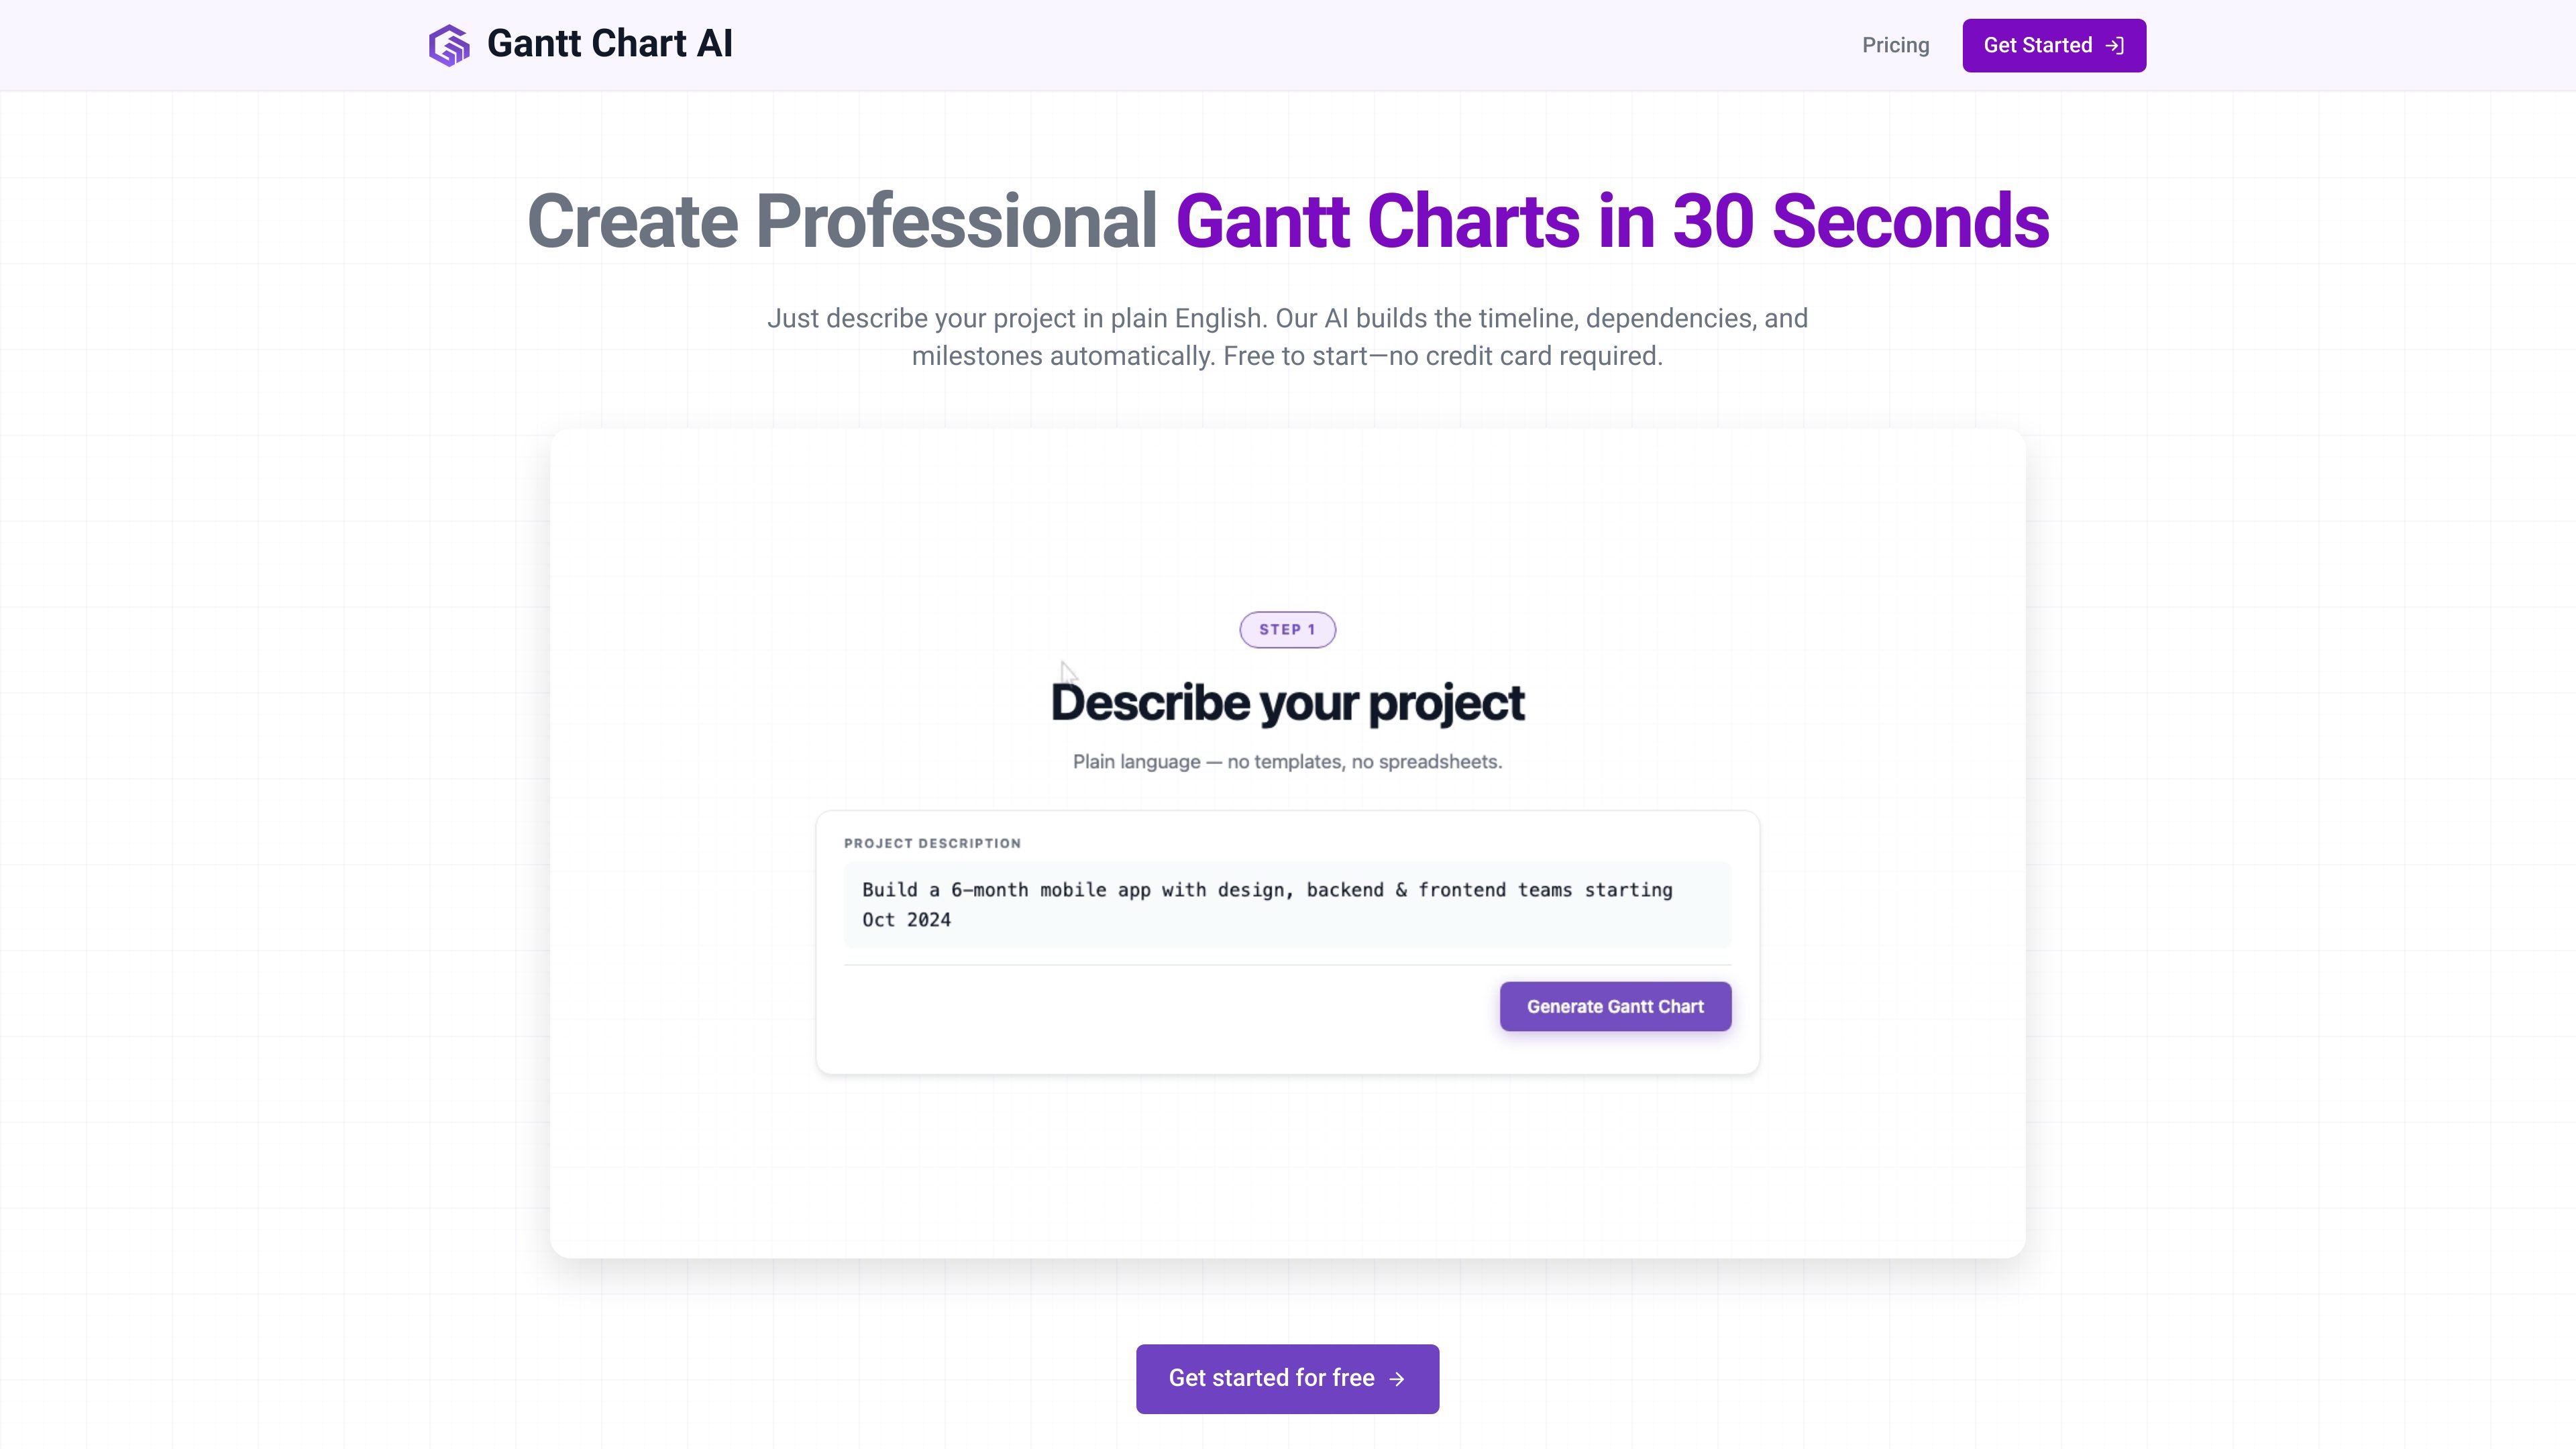
GanttChart.AI is a browser-based project planning tool that uses AI to turn plain-language project descriptions into Gantt charts. The homepage says it generates timelines, dependencies, and milestones automatically, then lets users refine the result in a visual editor.
The product is aimed at people who want a faster way to build project schedules without starting from a blank chart. Its workflow centers on describing a project, generating milestones, editing them, and then exporting or sharing the timeline through spreadsheet-based formats and Google Sheets.
Describe a project in plain English and the system generates tasks, timelines, dependencies, and milestones automatically.
Adjust timelines, dependencies, milestones, and task details directly in the browser with a visual editor.
Use the Google Sheets workflow to edit and share timelines in a familiar spreadsheet environment.
Export charts to Excel, CSV, or JSON, and download charts for offline use.
Store previously created charts in a dashboard so they can be accessed later when logged in.
Start with a free tier before moving to paid plans if you need more credits or full editor access.
Plan projects that have clear tasks, durations, and dependencies, then refine the schedule after the AI generates the first draft.
Map sequential work for teams in software development, construction, or manufacturing where dependencies matter.
Prepare a structured timeline for events or product launches where milestones and dates need to be visible at a glance.
Use the Google Sheets workflow when a team prefers spreadsheet editing, review, and sharing over dedicated project management software.
GanttChart.AI is a web-based AI planning tool that turns a project description into a Gantt chart, then lets you refine it in a browser-based editor.
The source says generation typically takes less than 2 minutes from start to finish, and the homepage also describes creating charts in about 30 seconds.
The site says you can export Gantt charts to Excel, CSV, or JSON formats, and the homepage also mentions saving to Google Sheets.
The FAQ and guide suggest it works best for projects with clear tasks, durations, and dependencies, including construction, software development, event planning, and product launches.
The site shows a sign-in flow and mentions sharing with team members, but it does not provide a separate collaboration feature list beyond editing, sharing, and access from the dashboard.