
AI spreadsheet assistant
Ask questions in plain English and have Sourcetable produce analyses, summaries, charts, or spreadsheet output from uploaded or connected data.

Sourcetable is an AI spreadsheet for analysts, operators, and finance teams, combining chat-based analysis with spreadsheet workflows, live connectors, charts, formulas, Python, and SQL.
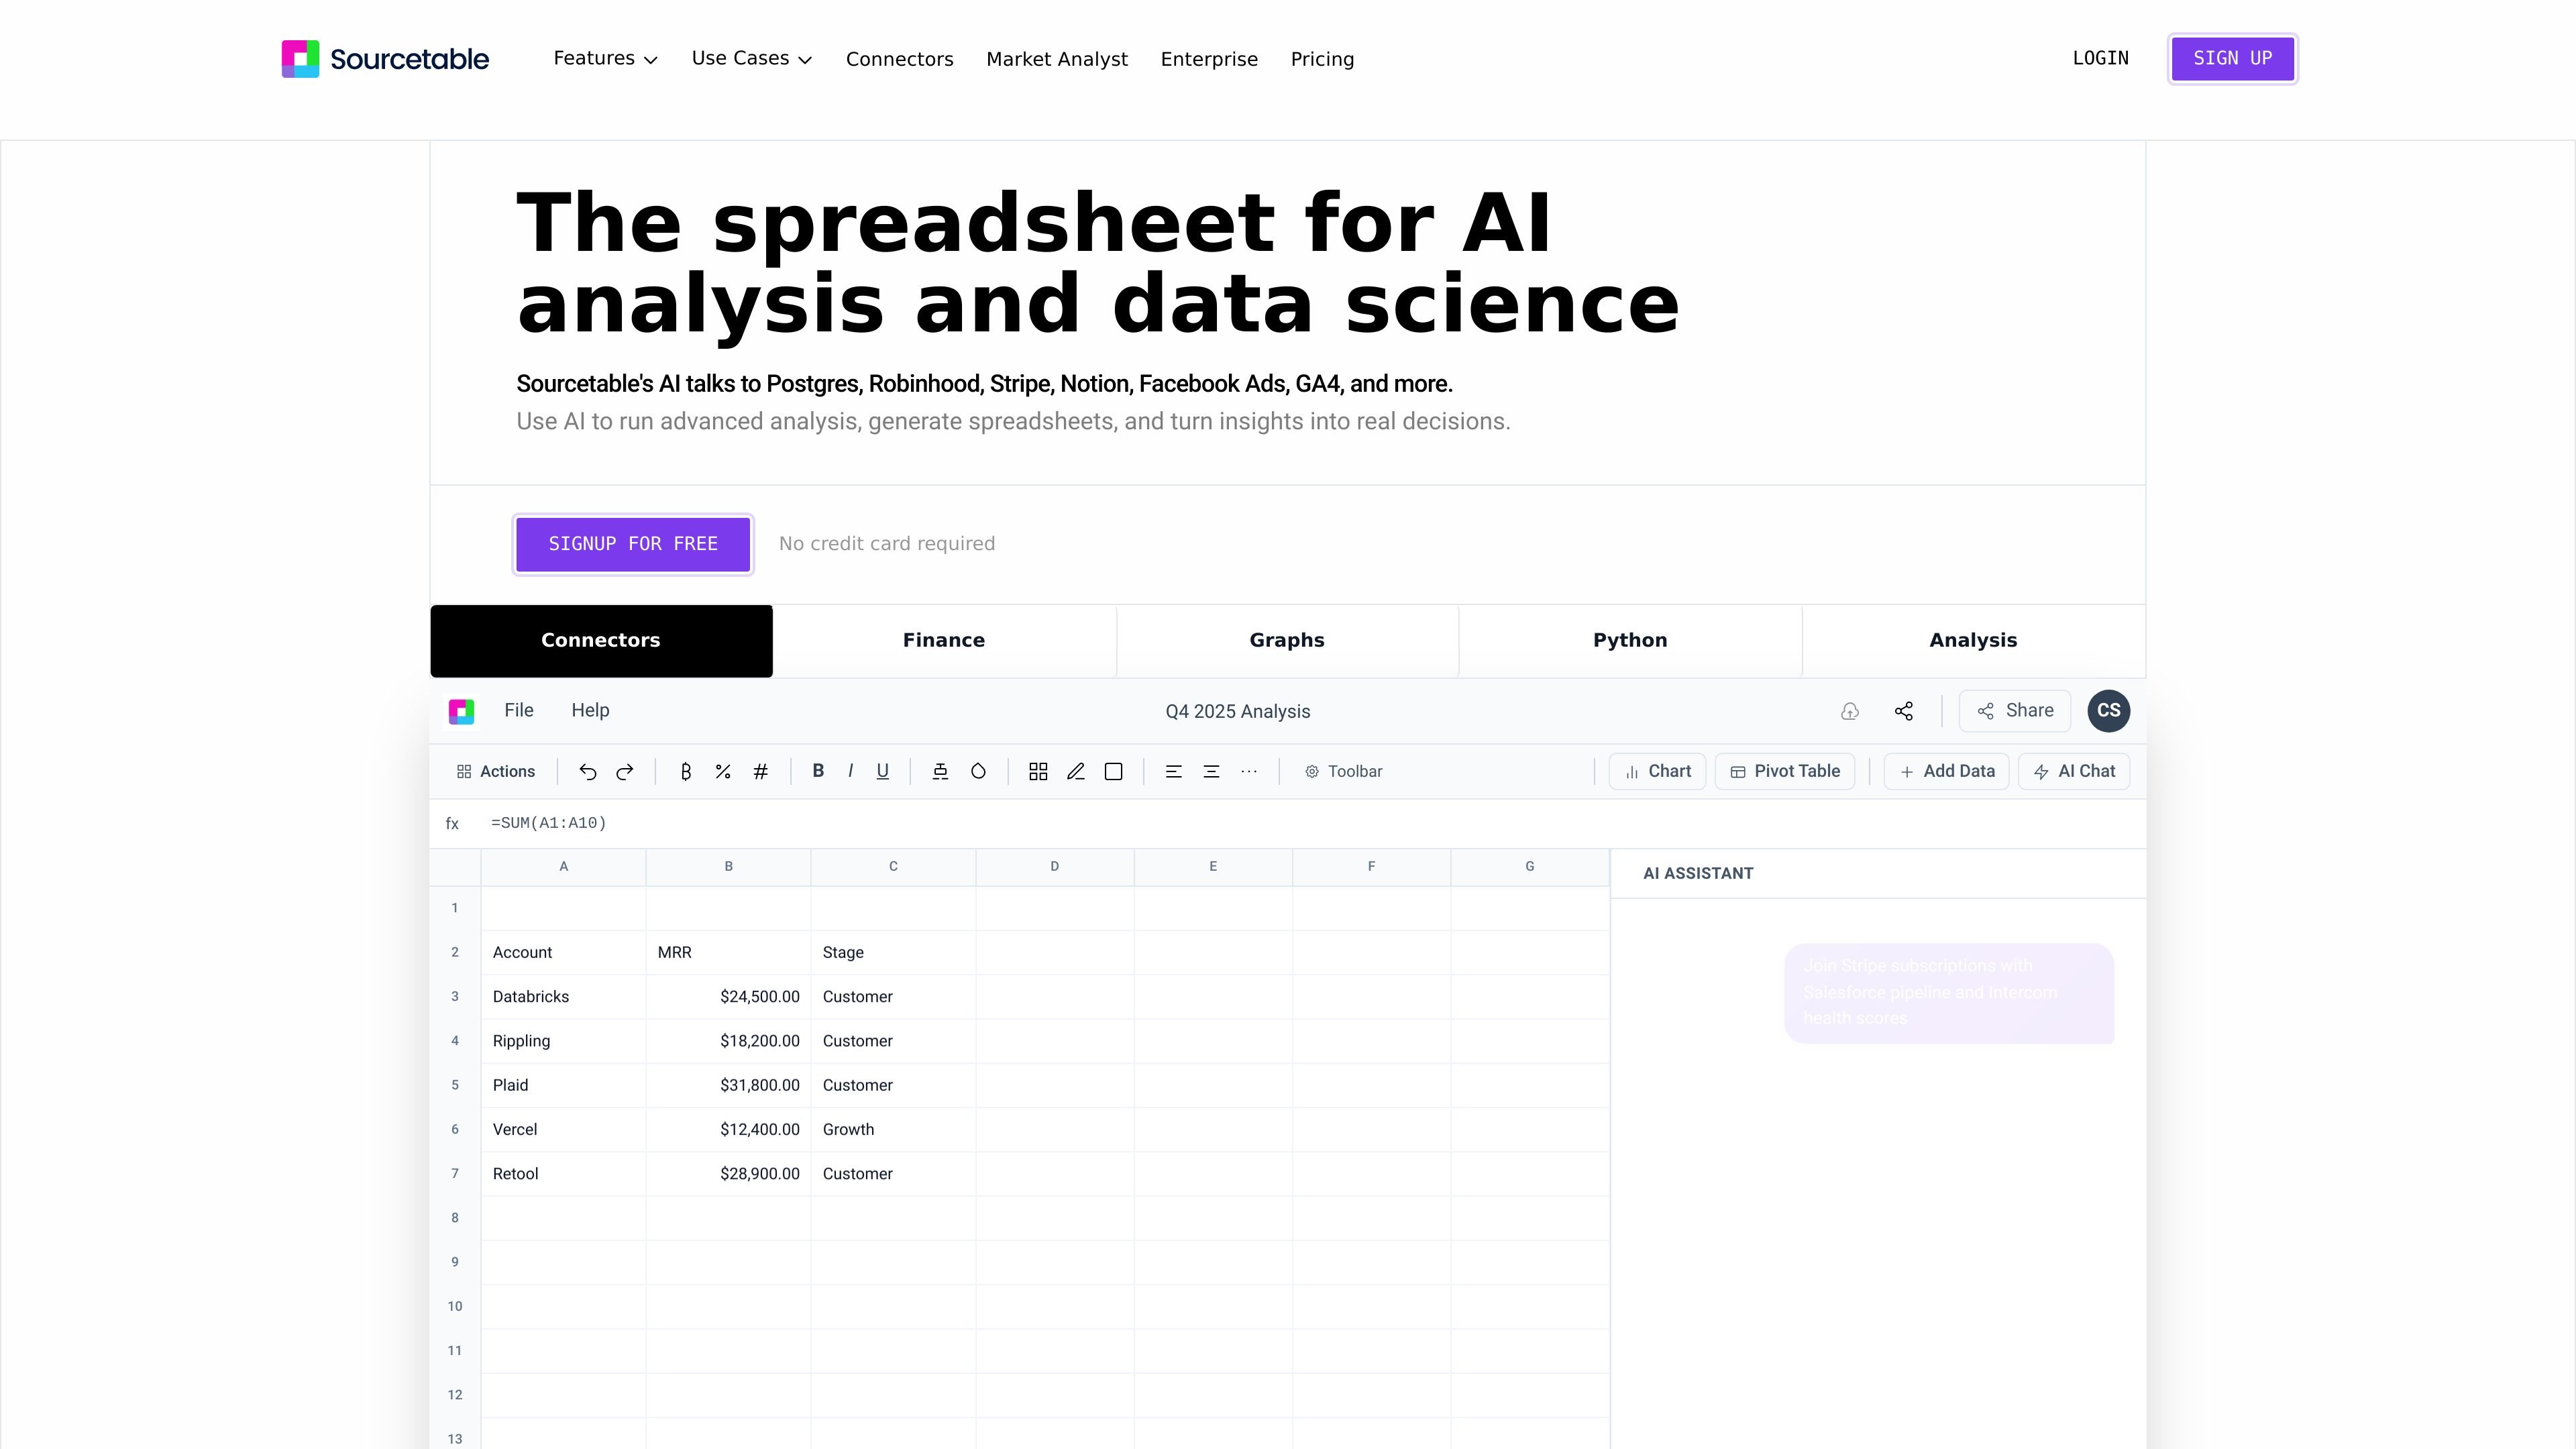
Sourcetable is an AI spreadsheet and data analysis workspace for analysts, operators, finance teams, and other users working with spreadsheets, databases, and application data. It combines chat-based analysis with familiar spreadsheet features so users can upload data, connect live sources, and explore results without leaving the sheet.
The product is designed to turn data into practical outputs such as models, dashboards, charts, summaries, and formulas. The site also highlights Python and SQL support, built-in research tools, and connectors for sources like PostgreSQL, QuickBooks, Xero, Stripe, Notion, Facebook Ads, and GA4, depending on the page and use case.
Ask questions in plain English and have Sourcetable produce analyses, summaries, charts, or spreadsheet output from uploaded or connected data.
Generate charts and graphs from prompts, with downloadable visuals and support for interactive embeds.
Clean, shape, and structure data using AI, formulas, or code so raw inputs can become usable datasets.
Use Python, SQL, and data-science libraries such as NumPy, Pandas, SciPy, Scikit-learn, StatsModels, Matplotlib, Plotly, and Seaborn for deeper analysis.
Connect to databases and applications such as PostgreSQL, BigQuery, GA4, Google Ads, MySQL, DuckDB, and others listed on the site.
Work with spreadsheet files, multiple tabs, and large files up to 10GB, with support for cross-tab analysis and manual spreadsheet control when needed.
Build revenue models, P&L summaries, and budget-vs-actual views from live or uploaded financial data. The finance page specifically calls out QuickBooks, Xero, PostgreSQL, and Excel uploads for this workflow.
Ask ad hoc questions, run statistical models, and create recurring reports without waiting on an engineering team. Sourcetable also supports charts, formulas, and manual spreadsheet control for follow-up analysis.
Track SLAs, capacity, and weekly business reviews from live data, using the same workspace to query, summarize, and visualize operational metrics.
Clean experimental datasets, analyze research results, and generate visualizations to identify patterns in findings. The product pages also note support for Python and common data-science libraries.
Analyze campaign performance and customer behavior with connected data sources such as Google Ads and GA4, then turn the results into charts or summaries.
Sourcetable lets you upload a spreadsheet or other supported data source and then ask questions in plain English. It can return analyses, summaries, charts, formulas, and other spreadsheet outputs, and you can also work manually with familiar spreadsheet, SQL, or Python tools.
The source pages list spreadsheets (.xls, .xlsx, .csv), tabular data (.tsv), PDF, JSON, plain text, and database data including MySQL, PostgreSQL, and MongoDB. They also mention application data, plus connectors such as QuickBooks and Xero on the finance page.
Yes. The finance page says Sourcetable can pull live QuickBooks and Xero data into financial models, and the Postgres connector page shows support for querying PostgreSQL data with AI.
Yes. The product pages say visualizations can be generated from prompts and exported as interactive embeds, and charts are downloadable.
The pricing page says the spreadsheet is free to use with usage limits on AI features, and that Pro and Max plans add more credits and capabilities.