
Application observability
Provides APM, distributed tracing, and profiling for cloud-native and enterprise stacks. The pricing page also describes automated root cause analysis, code-level profiling, and OpenTelemetry metrics and traces.

Dynatrace is an AI-powered observability platform for application, infrastructure, security, and digital experience visibility in one system.
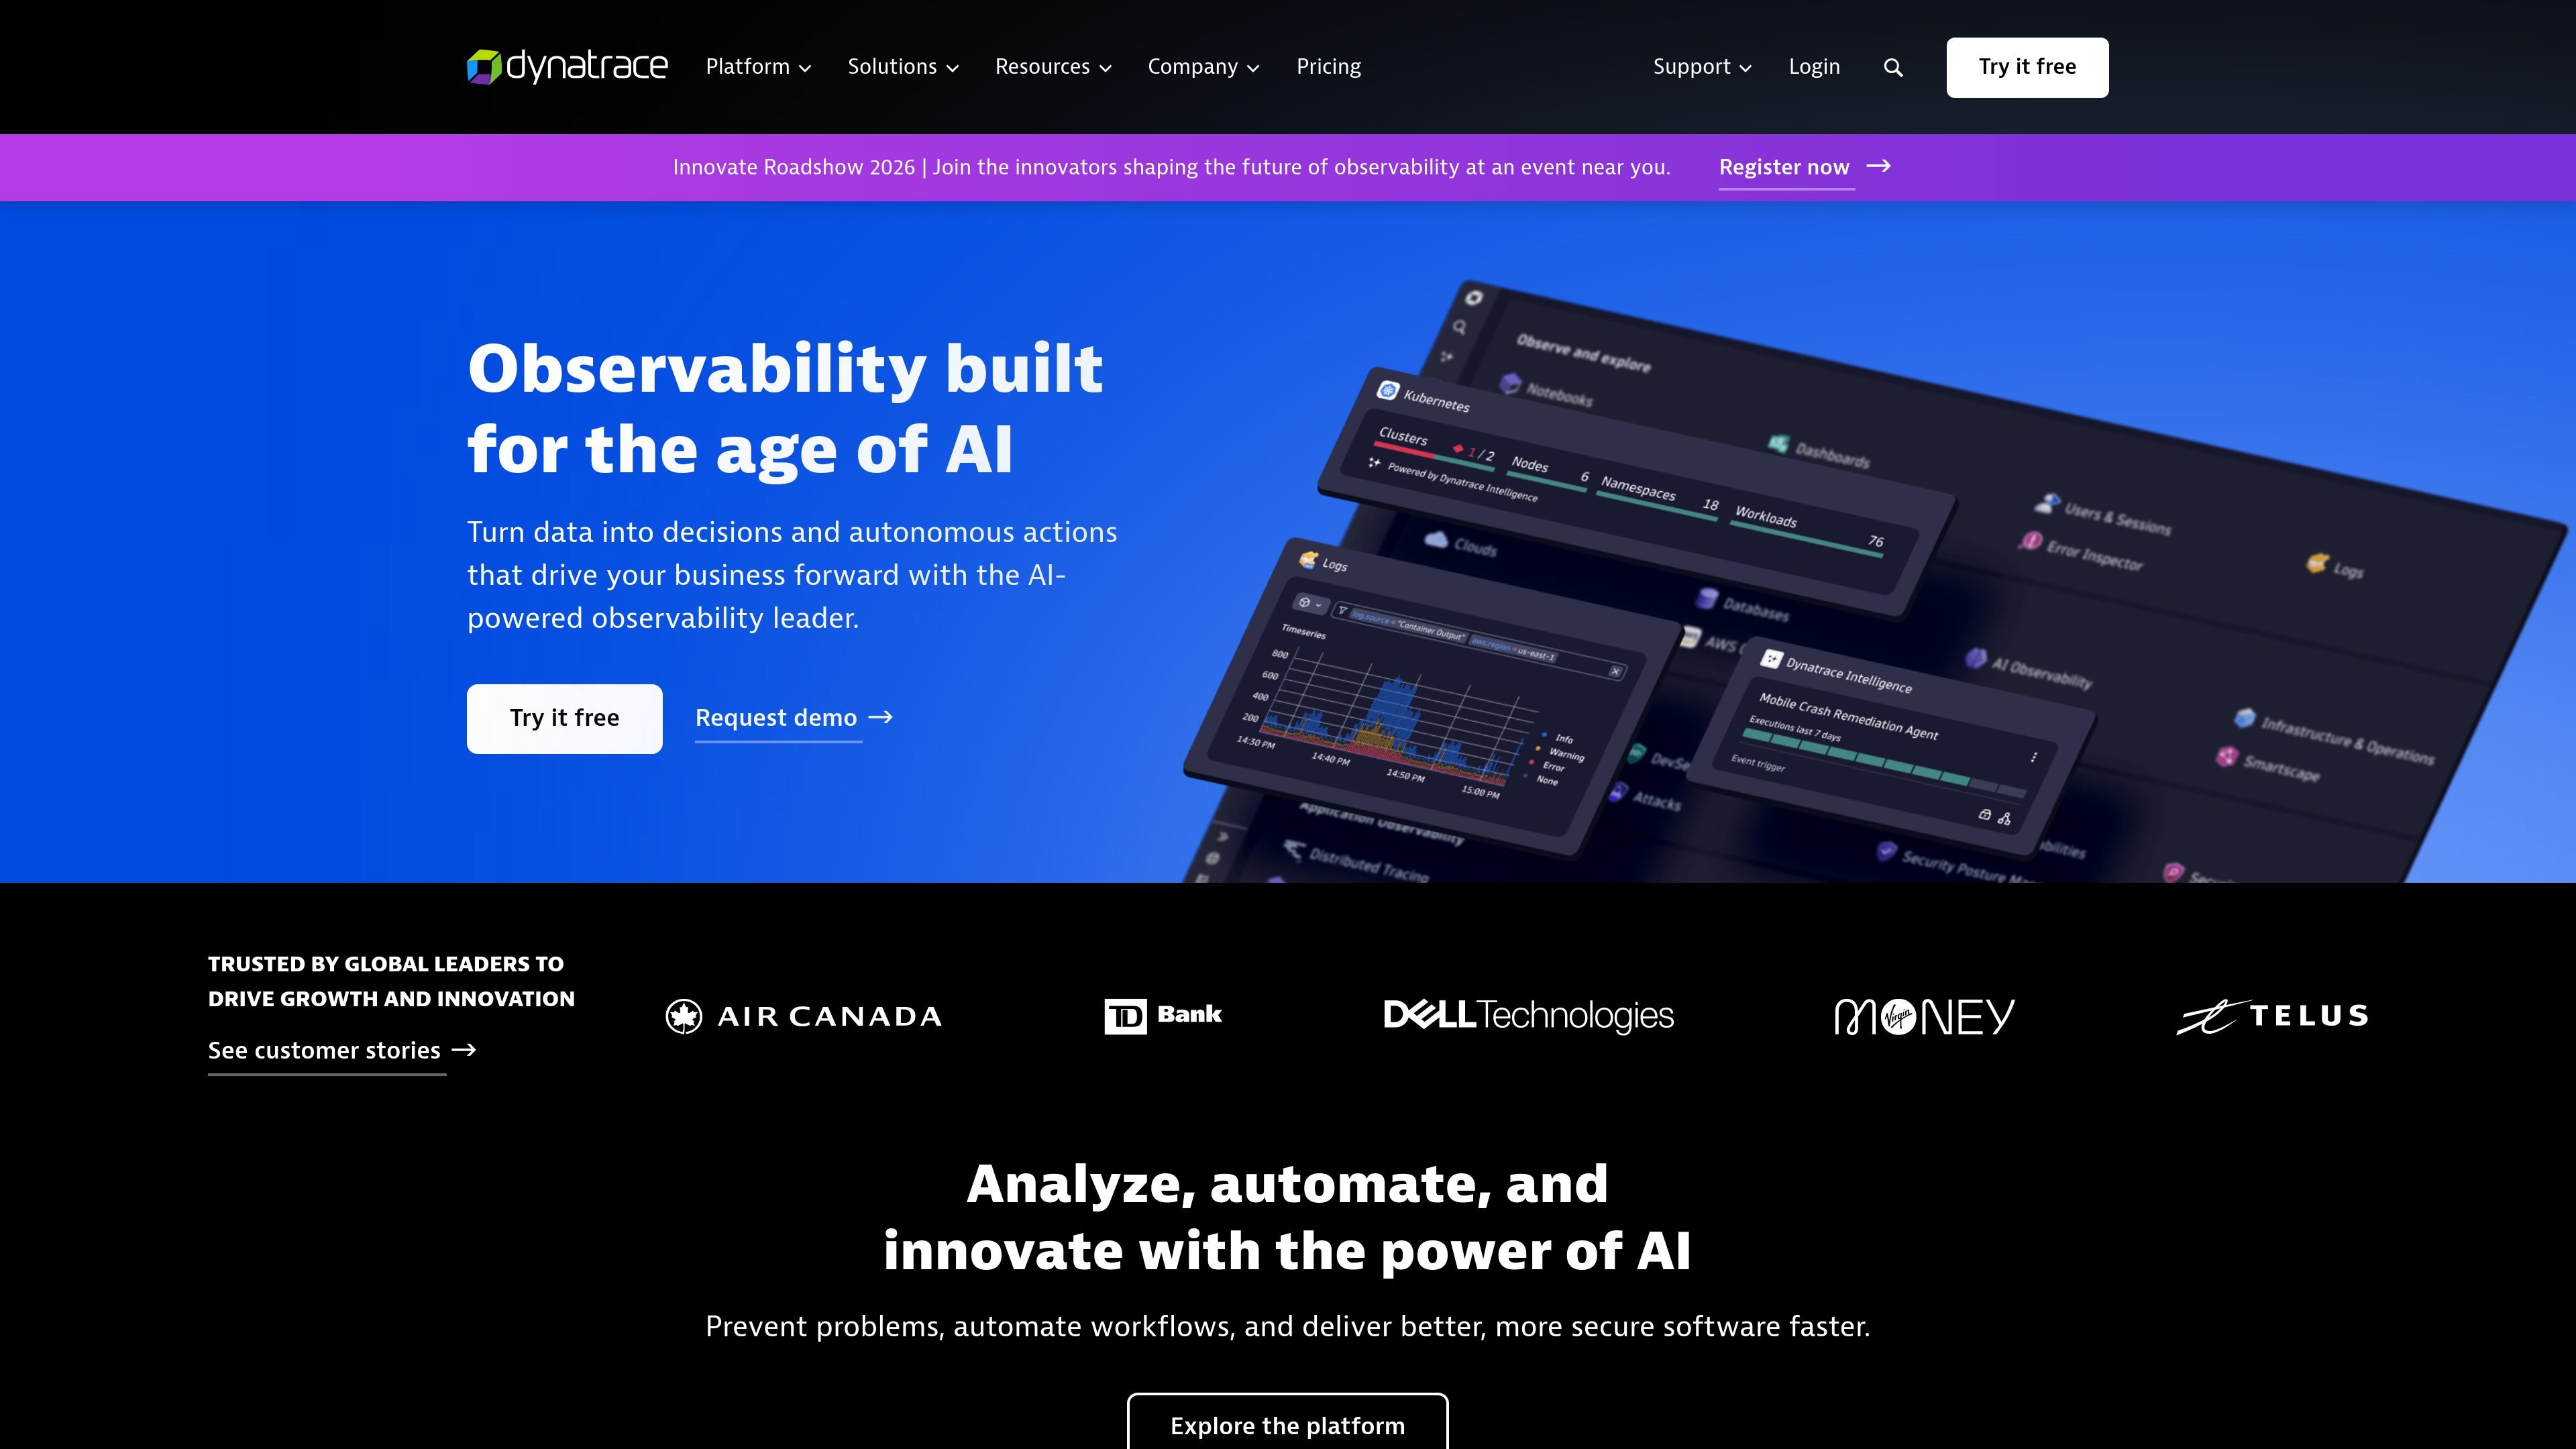
Dynatrace is a platform for observability, application security, and AI-assisted operations. It combines data collection, analysis, topology context, and workflow automation so teams can investigate issues and act on them from the same system.
The public site highlights support for applications, infrastructure, logs, digital experience, AI workloads, and security. Core platform concepts include unified data in Grail, automatic topology mapping with Smartscape, and agentic AI through Dynatrace Intelligence.
Provides APM, distributed tracing, and profiling for cloud-native and enterprise stacks. The pricing page also describes automated root cause analysis, code-level profiling, and OpenTelemetry metrics and traces.
Covers host and process topology, filesystem monitoring, OS service monitoring, and deeper analysis of process, disk, memory, and network behavior. Infrastructure-only and full-stack options are both listed on the pricing page.
Surfaces runtime vulnerabilities and attack protection, with options for vulnerability analytics and runtime application protection. The site describes security findings as integrated into core observability workflows.
Analyzes logs in context with topology enrichment, transformation, DQL-powered querying, and retention controls. The pricing page supports both pay-per-query and bundled query models.
Includes real user monitoring, session replay, and synthetic monitoring for web, mobile, browser, and HTTP scenarios. These modules focus on end-user journeys and service availability.
Uses Dynatrace Intelligence, Grail, Smartscape, OneAgent, and PurePath to contextualize data, map dependencies, ingest telemetry, and support AI-driven operations and automation.
Use application observability, distributed tracing, profiling, and root cause analysis to investigate slow or failing services across cloud-native and enterprise environments.
Track hosts, processes, storage, memory, network behavior, and topology to understand the state of cloud, hyperscaler, and data center infrastructure.
Use runtime vulnerability analytics and application security workflows to find and remediate vulnerabilities without leaving the observability platform.
Combine real user monitoring, session replay, and synthetic checks to validate journeys, reproduce issues, and monitor digital transactions.
Analyze logs alongside metrics, traces, and topology so troubleshooting can use contextual data rather than isolated log search.
Dynatrace is presented as a platform that combines observability, security, telemetry, analytics, and automation capabilities rather than a single-purpose tool.
The site highlights Smartscape for topology mapping, Grail for contextual data analysis, OneAgent for collection, and PurePath for distributed tracing.
Yes. The pricing page shows public subscription-based pricing with module-level unit pricing, volume discounts, and no penalties for exceeding commit.
Yes. The pricing page includes infrastructure-only and full-stack observability options, and the platform site presents separate application and infrastructure observability solutions.
Yes. The site lists application security and threat observability, and the pricing page includes runtime vulnerability analytics as a security option.