
Natural-language chart requests
Describe the chart you want in plain English instead of learning a scripting language or chart builder workflow. The product examples show prompts such as asking for a bar chart of sales by region.

Chat2CSV turns CSV files into charts with natural-language prompts, privacy-focused handling, and a free tier for quick, no-code data visualization.
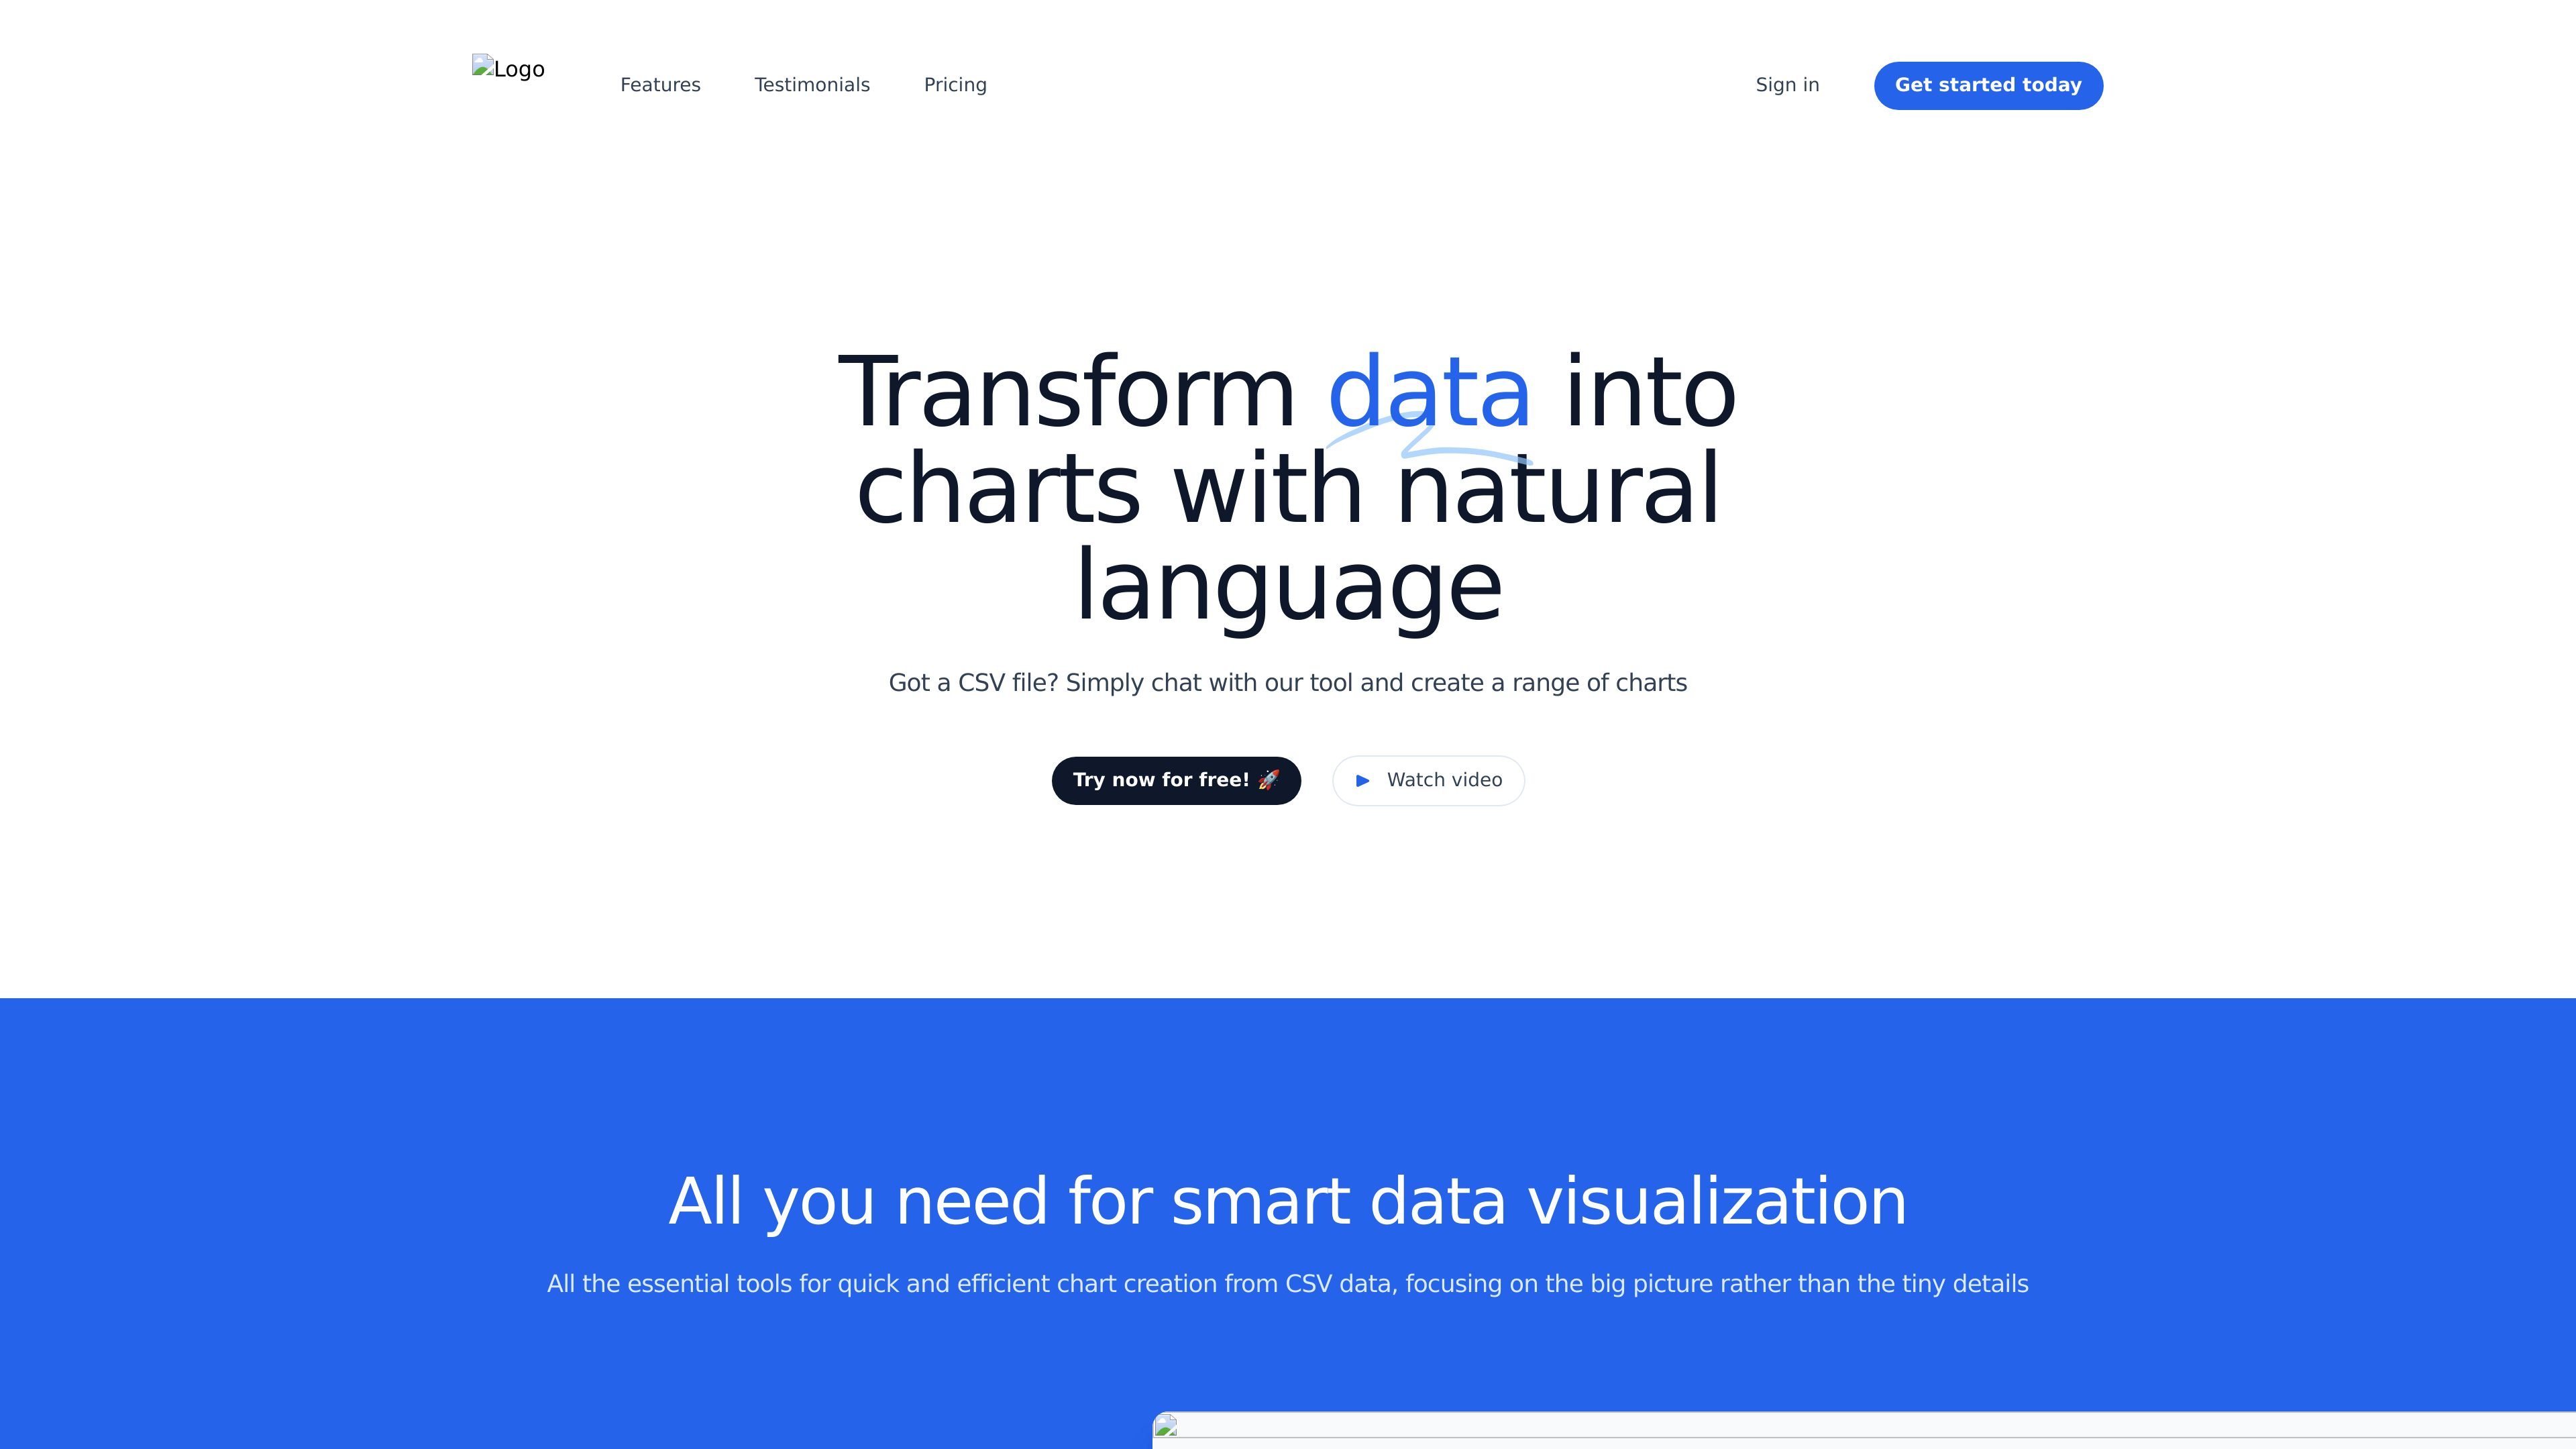
Chat2CSV is a CSV-to-chart visualization tool that lets you create charts by typing requests in natural language. The product is positioned for quick analysis of CSV data without coding or scripting, using an interface that turns plain-English instructions into visualizations.
The site emphasizes chart creation from CSV files, AI-assisted chart suggestions, and privacy-focused handling of data. It also states that the service processes only necessary metadata on its servers while the actual data remains on the user side, and it offers free access with usage limits plus a coming premium plan.
Describe the chart you want in plain English instead of learning a scripting language or chart builder workflow. The product examples show prompts such as asking for a bar chart of sales by region.
The platform can suggest chart types based on your data, which may help you choose a visualization that fits the dataset rather than guessing manually.
The site explicitly mentions line graphs, bar charts, pie charts, and scatter plots, and says the platform supports a wide range of chart types beyond those examples.
The product says it processes only the metadata needed on its servers while the actual data remains on your side, emphasizing privacy-aware handling.
Free access is available, with a stated usage cap of 15 queries per hour, one CSV file at a time, a 1 MB file limit, and five AI prompts per file.
The site lists a coming premium plan with higher limits, multi-file work, secure cloud storage, a personal dashboard, and chart history, though it is marked as coming soon.
Upload a CSV file and ask for a specific visualization, such as sales by region or product mix, when you want a quick chart without building one manually.
Use the AI’s chart suggestions when you have data but are not sure which visualization best matches the shape of the dataset.
Use the tool for fast, lightweight analysis when you need to inspect a single CSV and do not want to set up a coding environment.
Use the product when privacy is important and you want a workflow that keeps the actual data on your side while the server handles only necessary metadata.
Start with the free tier to test whether the natural-language workflow fits your team’s CSV analysis needs before considering the upcoming premium plan.
The site says CSV files are supported, and the FAQ specifies CSV only at the moment with headers.
You type a request in natural language, such as asking for a bar chart of sales by region, and the platform generates the chart from your CSV data.
The site says the platform supports a wide range of chart types, including line graphs, bar charts, pie charts, scatter plots, and more, and that the AI can suggest suitable chart types.
The FAQ says the servers process only necessary metadata while the actual data remains on your side, and the product copy describes the service as privacy-focused.
The current free access allows you to explore the product with minor daily limitations.