
Natural-language analysis
Ask questions in plain English or another language and receive charts, tables, and answers from your data.

Analisi dei dati con AI per domande, grafici, fogli di calcolo e report
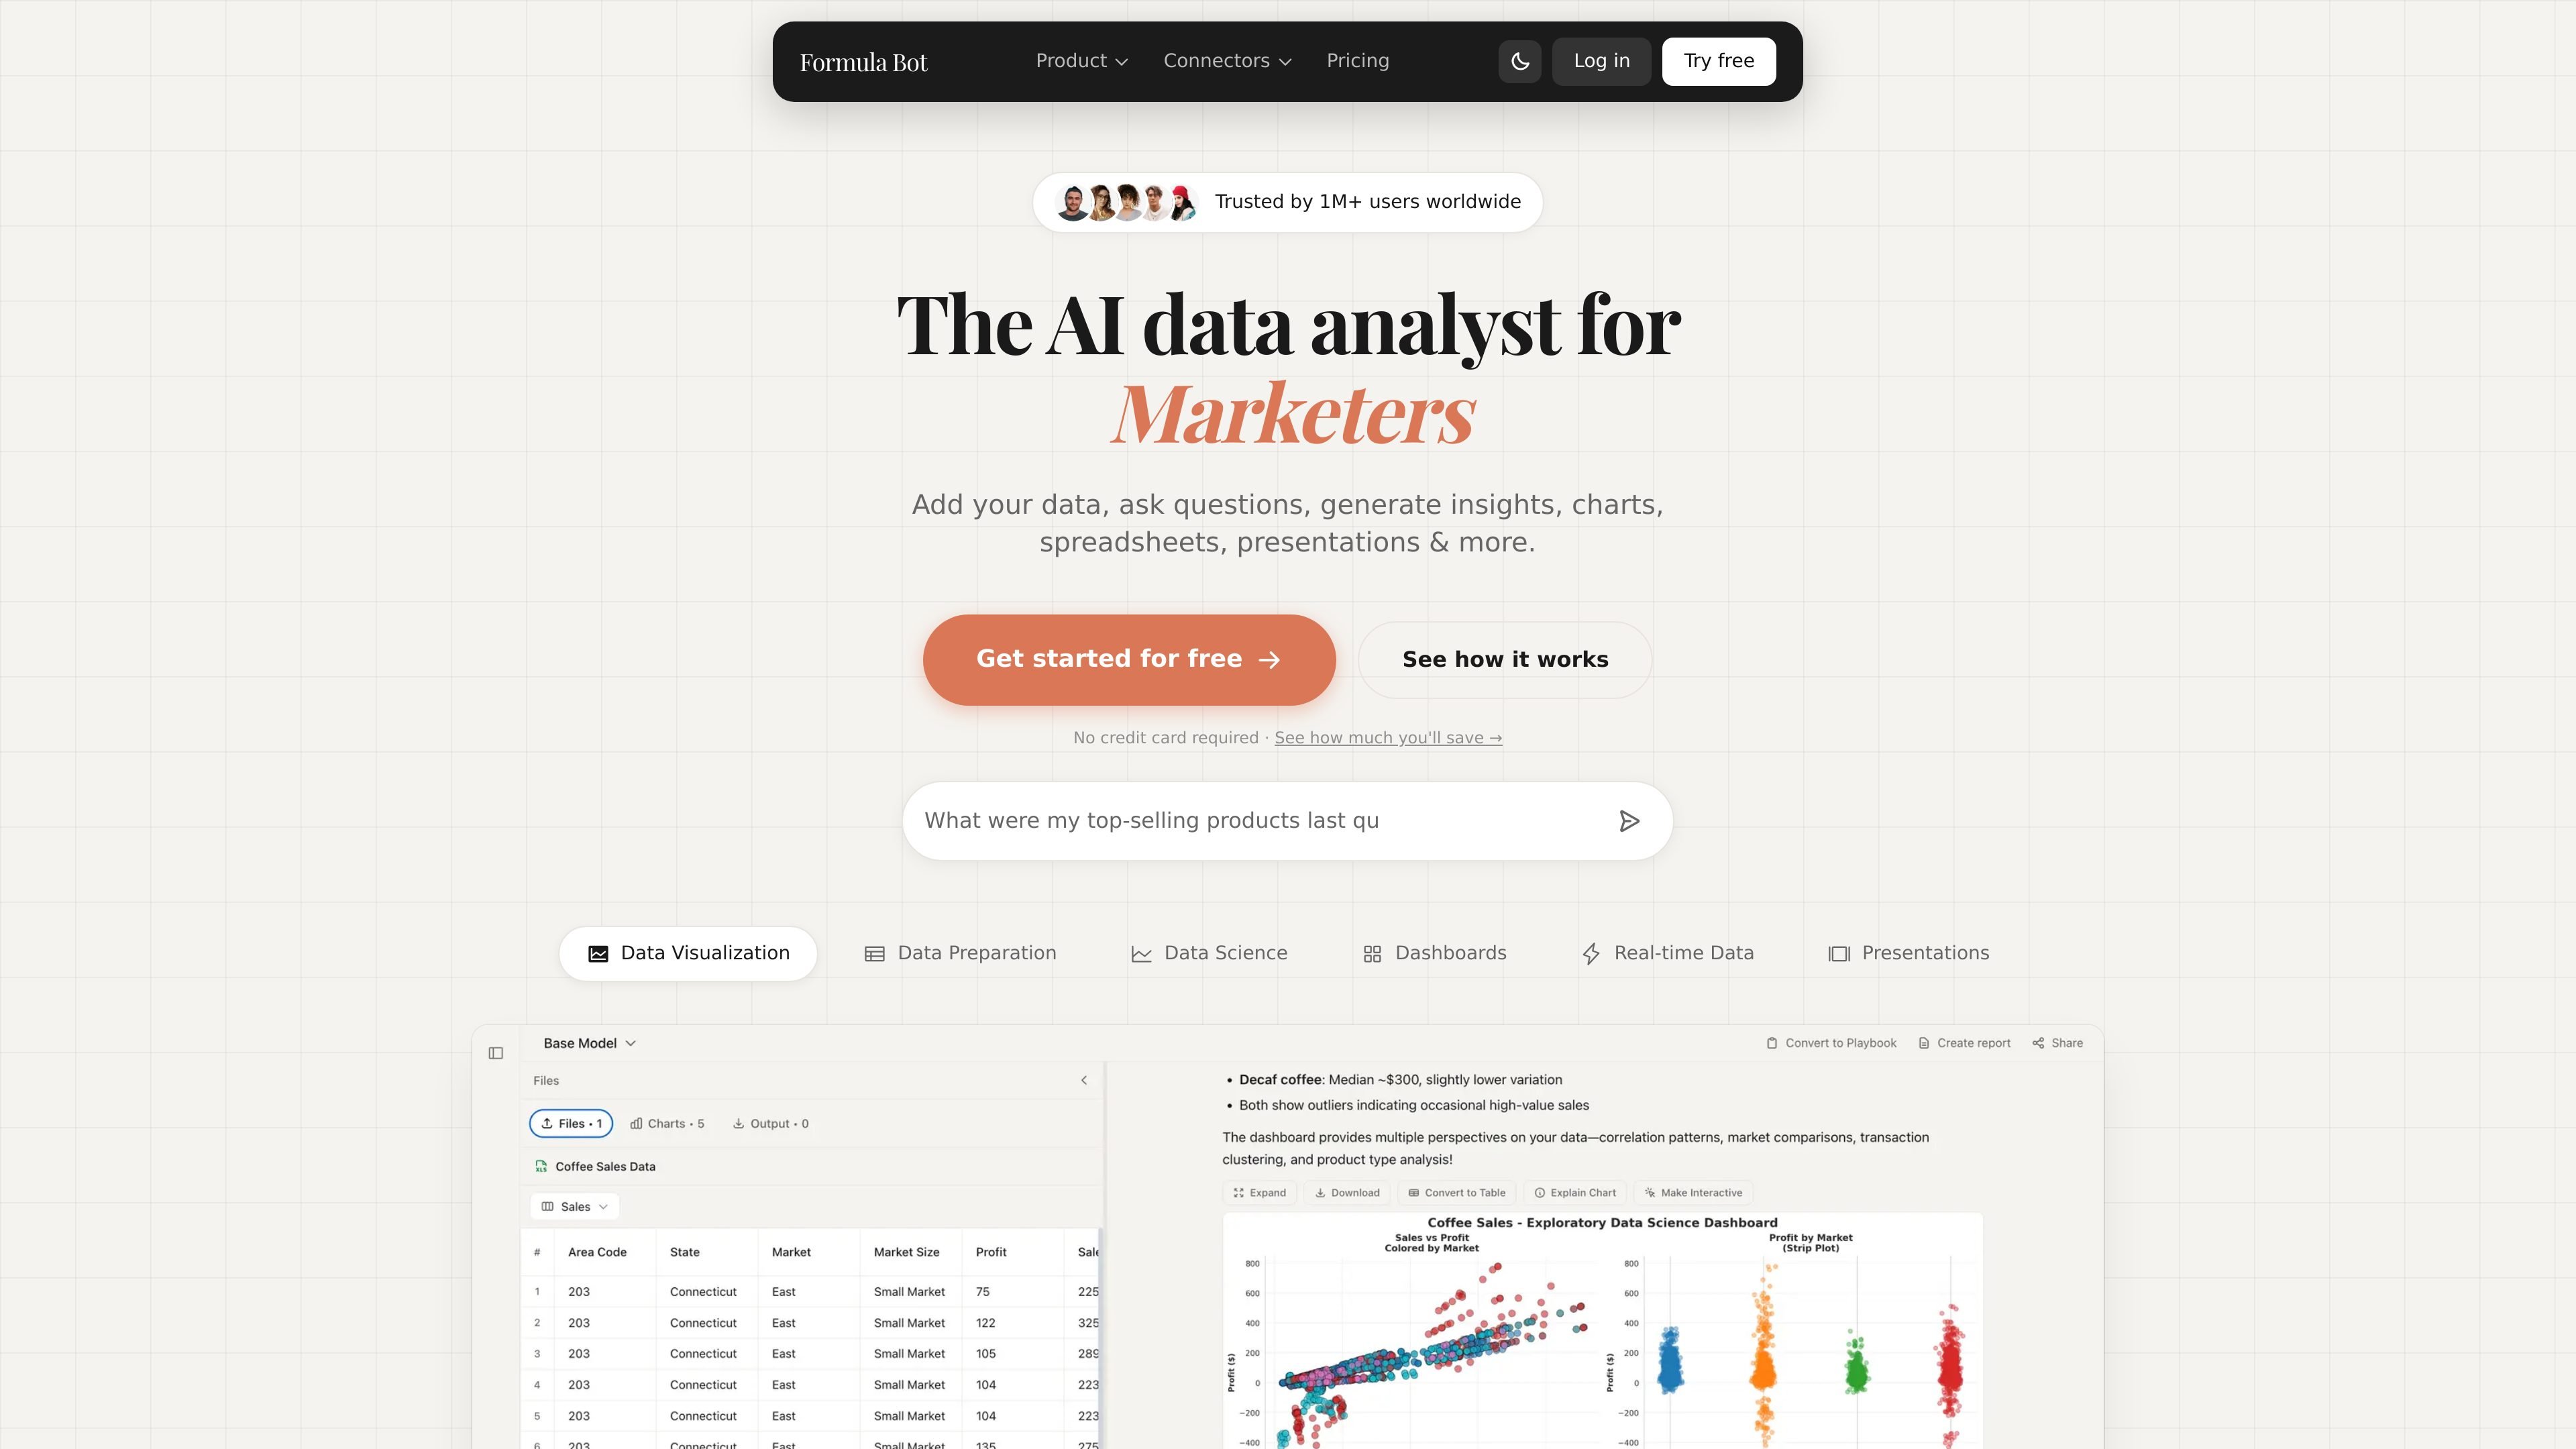
Formula Bot is an AI data analytics platform for asking questions about data, generating formulas, creating charts, and producing reports from spreadsheets and other connected sources. The homepage positions it as a tool for business owners and data teams that want faster analysis without manual spreadsheet work.
Across the site, Formula Bot presents a workflow that starts with uploading or connecting data, then asking questions in natural language, and then turning the result into charts, dashboards, spreadsheets, presentations, or scheduled reports. It also includes text analysis, data preparation, knowledge-base-assisted SQL queries, and web scraping for broader analysis tasks.
Ask questions in plain English or another language and receive charts, tables, and answers from your data.
Turn raw data into clear visualizations, including charts, graphs, bars, lines, KPIs, and sparklines.
Clean, standardize, merge, reshape, filter, and reformat data from multiple sources before analysis.
Build interactive dashboards from templates, customize chart and layout details, and schedule automatic refreshes.
Connect spreadsheets, databases, PDFs, and martech sources, and add knowledge base files to improve SQL accuracy.
Generate spreadsheets, formatted reports, and code in Python, SQL, or R, with code transparency for each request.
Upload or connect a dataset, ask a question in plain English, and use the returned charts or tables to answer ad hoc business questions.
Generate dashboards from a template, edit the layout and labels, and schedule the dashboard to refresh on a daily, weekly, or monthly cadence.
Clean and reshape messy files by merging sources, filtering rows, reformatting columns, and preparing data for analysis.
Analyze customer feedback or other text with sentiment detection, keyword extraction, or translation.
Create spreadsheets, formatted reports, or code outputs when you need a shareable artifact instead of only an on-screen answer.
Formula Bot is an AI data analytics platform that lets you ask questions about your data in plain English, generate charts, create spreadsheets and reports, and automate recurring analysis.
The site shows support for spreadsheets, databases, PDFs, martech data, and web scraping, with dashboards, scheduled reporting, text analysis, and knowledge bases for SQL queries.
The pricing page shows a Starter plan at $18 per month with monthly and yearly billing options, and the site also offers a free starting point and a custom plan inquiry form.
Yes. The site says dashboards can be scheduled to refresh daily, weekly, or monthly, and customizations persist across refreshes.
The site says data is stored and executed in an isolated sandbox, encrypted in transit and at rest, and not used to train AI models.
I dati sul traffico sono solo a scopo di riferimento.

pandada.ai
Pandada AI è uno strumento di analisi dei dati basato su browser per pulire file, porre domande e creare grafici o report. Supporta i formati comuni di documenti e fogli di calcolo, con un piano Basic gratuito e un livello Plus a pagamento.

excelmatic.ai
Strumento di analisi dei fogli di calcolo con IA nel browser, che trasforma Excel, CSV, tabelle PDF e screenshot in grafici, dashboard, riepiloghi e report da verificare.

graphy.app
Graphy è uno strumento web per creare grafici che trasforma i dati di fogli di calcolo, file, API o ricerche AI in grafici e dashboard condivisibili, ideali per visual personalizzati, report rapidi e contenuti incorporabili.

datasquirrel.ai
DataSquirrel.ai è una piattaforma web di analisi dei dati con AI per utenti aziendali non tecnici. Consente di pulire, analizzare, visualizzare e condividere fogli di calcolo e dati connessi senza formule, tabelle pivot, SQL o programmazione.

gptexcel.uk
Assistente IA per fogli di calcolo, formule, SQL, script e analisi dei dati

autoplot.ai
Autoplot è un’app nativa per Mac dedicata alla rappresentazione e all’analisi scientifica: trasforma dati tabellari in grafici, fit e risultati riutilizzabili. Supporta flussi di lavoro locali, esportazioni pronte per la pubblicazione e la preparazione dei dati assistita dall’AI, facoltativa.