
AI analyst agents
Supaboard positions its analyst agents as a way to ask questions in natural language and get business answers back from connected data.

Business intelligence avec IA pour données connectées, requêtes en langage naturel et tableaux de bord collaboratifs
Supaboard is an AI business intelligence platform that helps teams analyze connected data, ask questions in natural language, and create dashboards and reports without starting from scratch each time. The site frames it as an AI analyst for businesses that want faster answers from data.
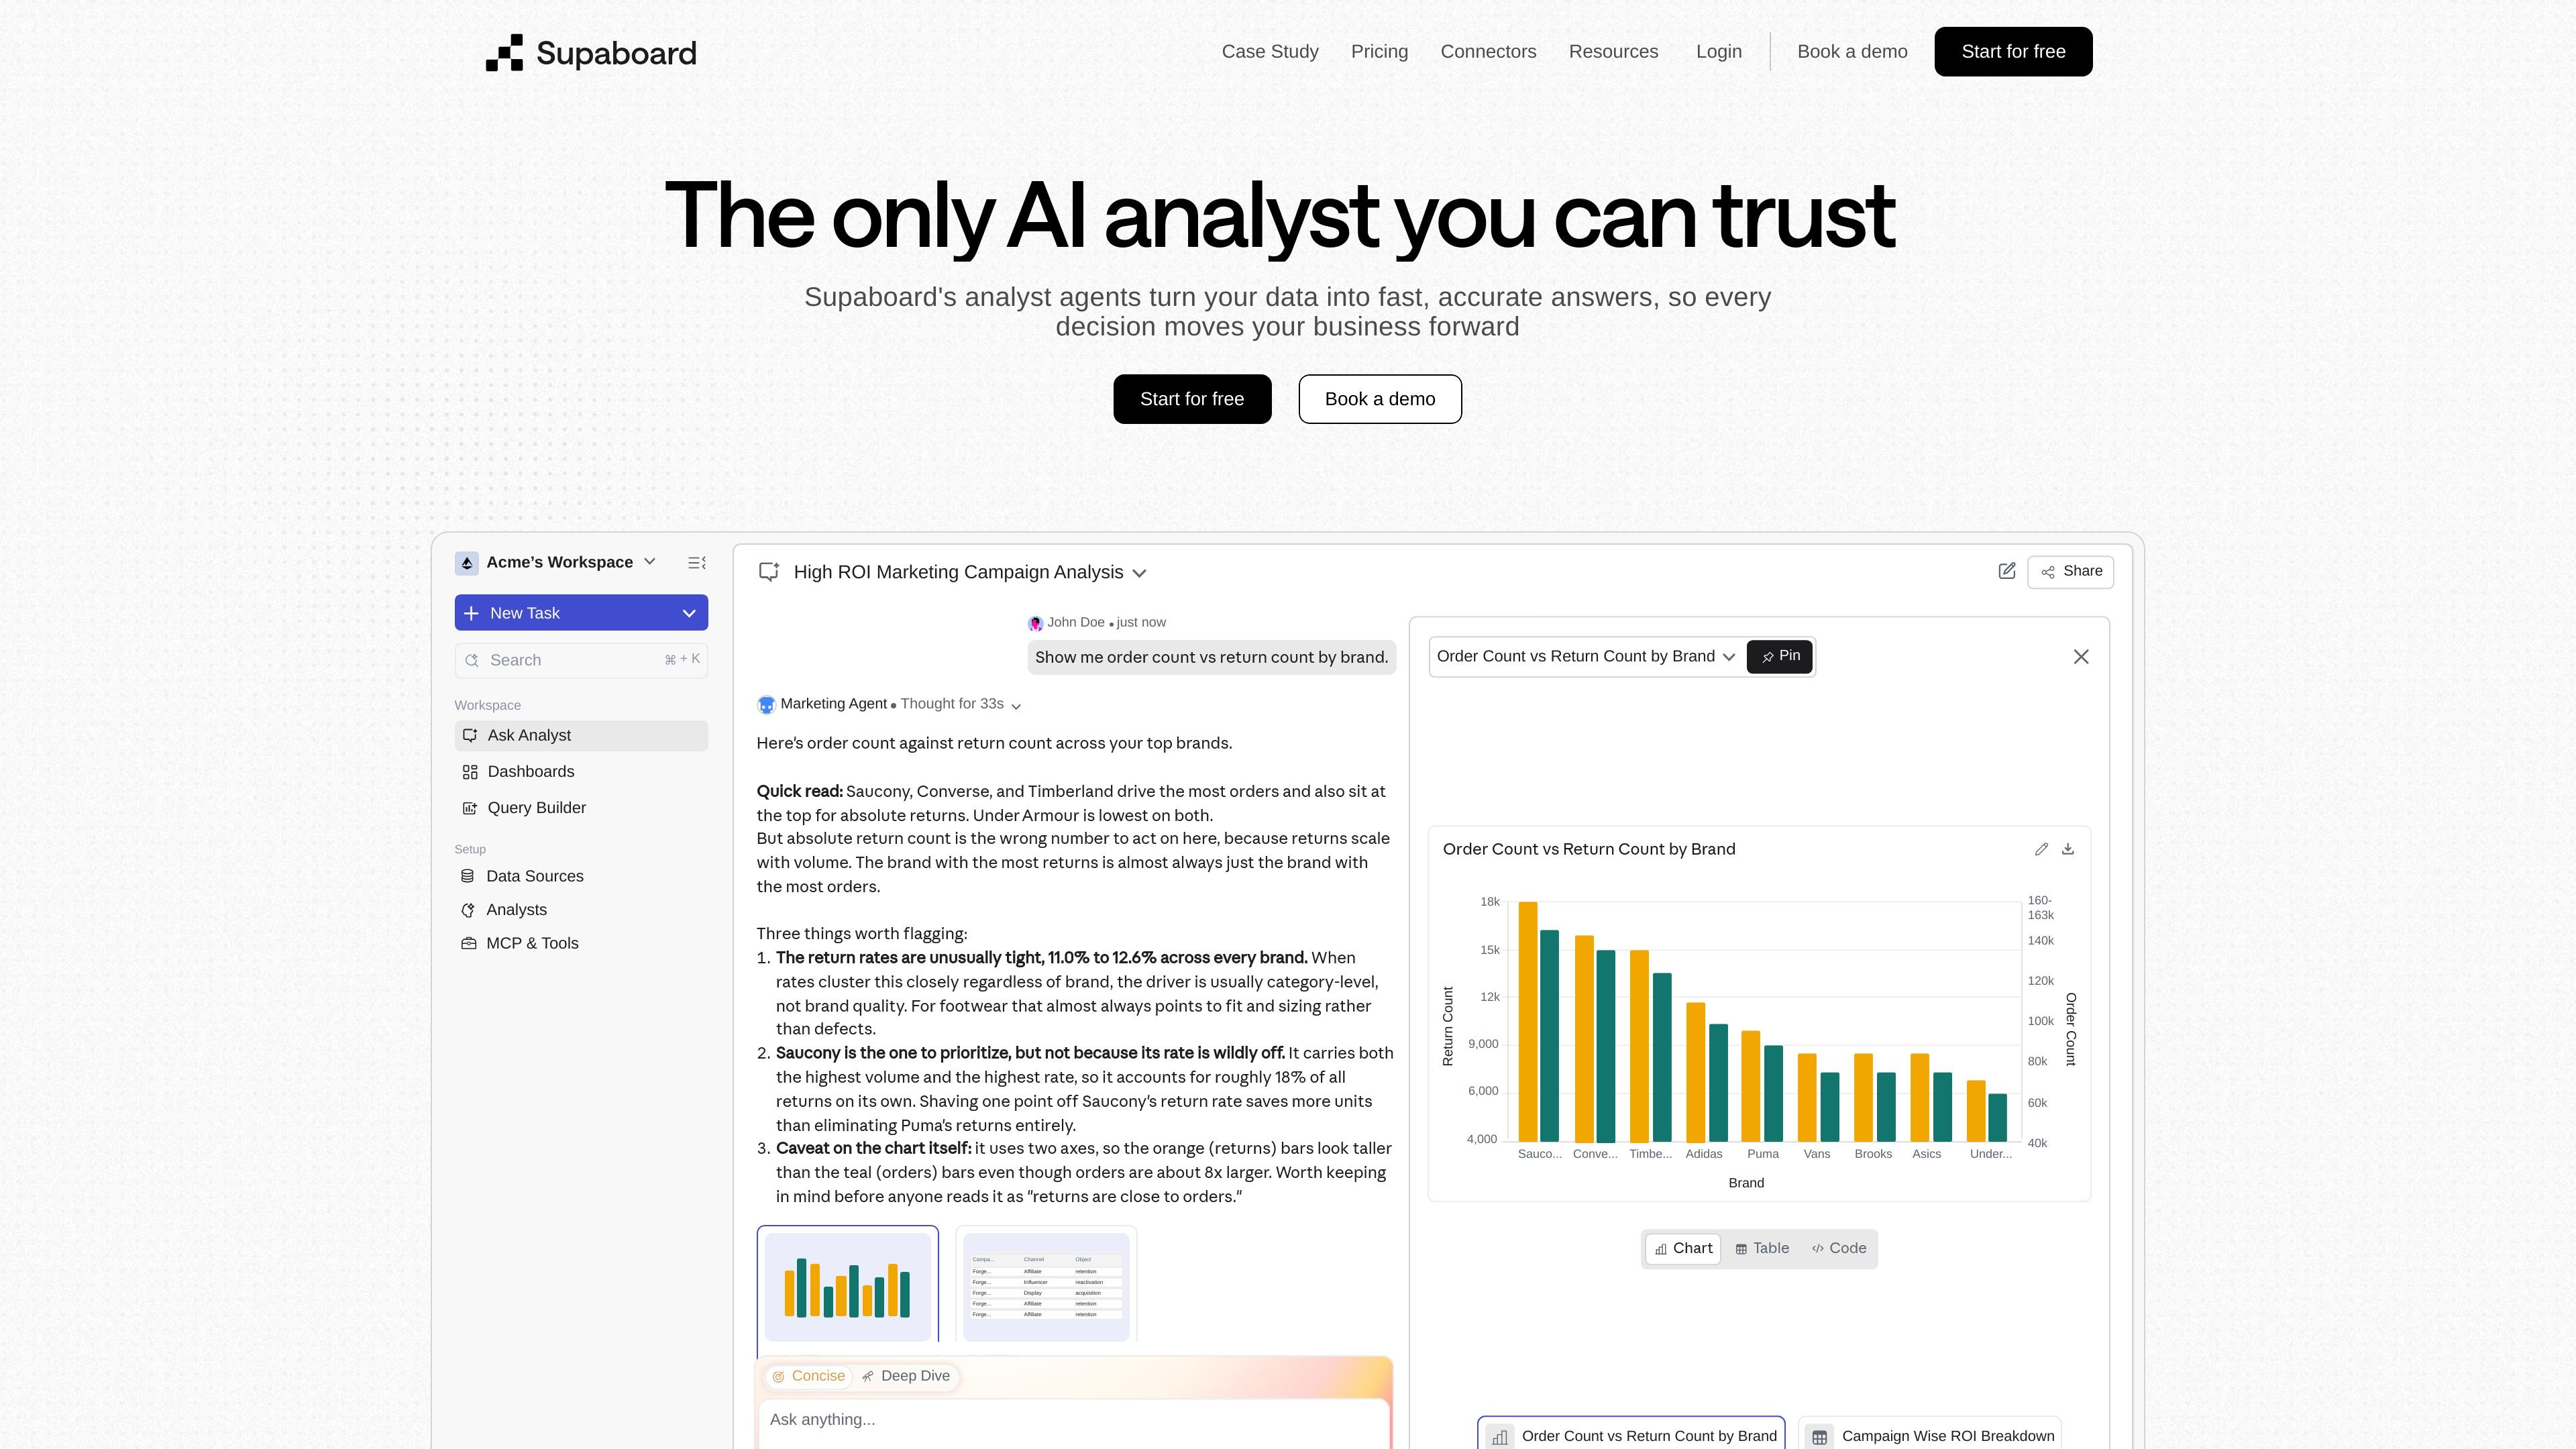
The product combines analyst agents, dashboard building, and an AI-assisted query builder. In the examples shown on the site, users can explore campaign performance, returns, customer acquisition, and other business questions through prompts, charts, tables, and SQL-assisted workflows.
Pricing is organized into Individual, Business, and Enterprise plans. The plans differ by the number of agents, integrations, collaboration features, and support level, with Enterprise offered as a custom option with a demo flow.
Supaboard positions its analyst agents as a way to ask questions in natural language and get business answers back from connected data.
The platform supports dashboard creation from a single prompt, with widgets for marketing, returns, funnels, and campaign performance shown on the product pages.
A query builder with AI assistance can generate, fix, and visualize SQL queries, which is useful for users who still work directly with SQL.
Pricing and product pages show support for dashboards, reports, visual exploration, and drill-down, giving teams multiple ways to inspect the same data.
The integrations page shows connectors across data, analytics, finance, operations, marketing, engineering, product, people, and HR categories.
Plan details include automation, scheduled deliveries or runs, alerting, and team collaboration features such as Slack and Teams integration.
Marketing and growth teams can use prompt-based dashboards to review campaign spend, acquisition, revenue, and return-related metrics in one place.
Operations or finance users can ask questions in plain language and inspect trends, counts, and breakdowns without building every report manually.
Analysts who still work in SQL can use the query builder to generate, edit, and visualize queries while keeping control over the underlying logic.
Leadership and cross-functional teams can share dashboards, use Slack or Teams integrations, and rely on scheduled runs or alerts for recurring reporting.
Organizations with multiple systems can connect business apps, databases, warehouses, and productivity tools to create a broader view of their data.
Supaboard is an AI business intelligence platform that connects to data sources, lets users ask questions in natural language, and generates dashboards and analytics outputs from those queries.
The pricing page shows Individual, Business, and Enterprise plans. Individual and Business are priced per user per month, while Enterprise is custom and requires booking a demo.
The pricing page lists support for SQL data sources, business apps, warehouses, Slack and Teams integrations, query builders, automated scheduling, and security features that vary by plan.
Supaboard presents analytics workflows such as asking analysts questions, building dashboards from prompts, and generating or fixing SQL queries with an AI query assistant.
The source does not provide a complete public list of every supported connector on the home page, so the exact integration set may depend on plan and use case.
Les données de trafic sont fournies à titre indicatif uniquement.

www.basedash.com
Basedash est une plateforme d’informatique décisionnelle basée sur l’IA qui analyse les données, crée des tableaux de bord et permet aux équipes d’importer et d’exporter des fichiers Excel. Les utilisateurs peuvent poser des questions en langage courant et exporter les données des graphiques au format .xlsx.

minusx.ai
Plateforme BI agentique open source pour questions, tableaux de bord et données

graphy.app
Graphy est un outil web de création de graphiques qui transforme les données de feuilles de calcul, fichiers, API ou recherches AI en graphiques et tableaux de bord partageables, pour des visuels de marque, des rapports rapides et des intégrations.

chartgen.ai
ChartGen AI est un générateur de graphiques IA en ligne qui transforme des fichiers CSV, Excel, données collées ou sources connectées en graphiques et tableaux de bord.

chat2csv.com
Chat2CSV transforme les demandes en langage naturel en visualisations de données à partir de fichiers CSV. Créez rapidement des graphiques sans coder, avec une gestion des données axée sur la confidentialité et un accès gratuit.

atlas.new
Atlas est une plateforme SIG accessible depuis un navigateur, conçue pour créer des cartes, analyser des données de localisation et partager des travaux spatiaux en équipe. Elle propose cartographie assistée par AI, analyse spatiale, tableaux de bord et collaboration, sans expérience préalable en SIG.