
AI report generation from spreadsheets
Upload Excel or CSV files and have the system generate a presentation-style report from the data, including charts, insights, summaries, and recommendations.

ExcelDashboard Ai turns Excel or CSV files into AI-generated presentation decks and analysis reports with charts, summaries, and recommendations.
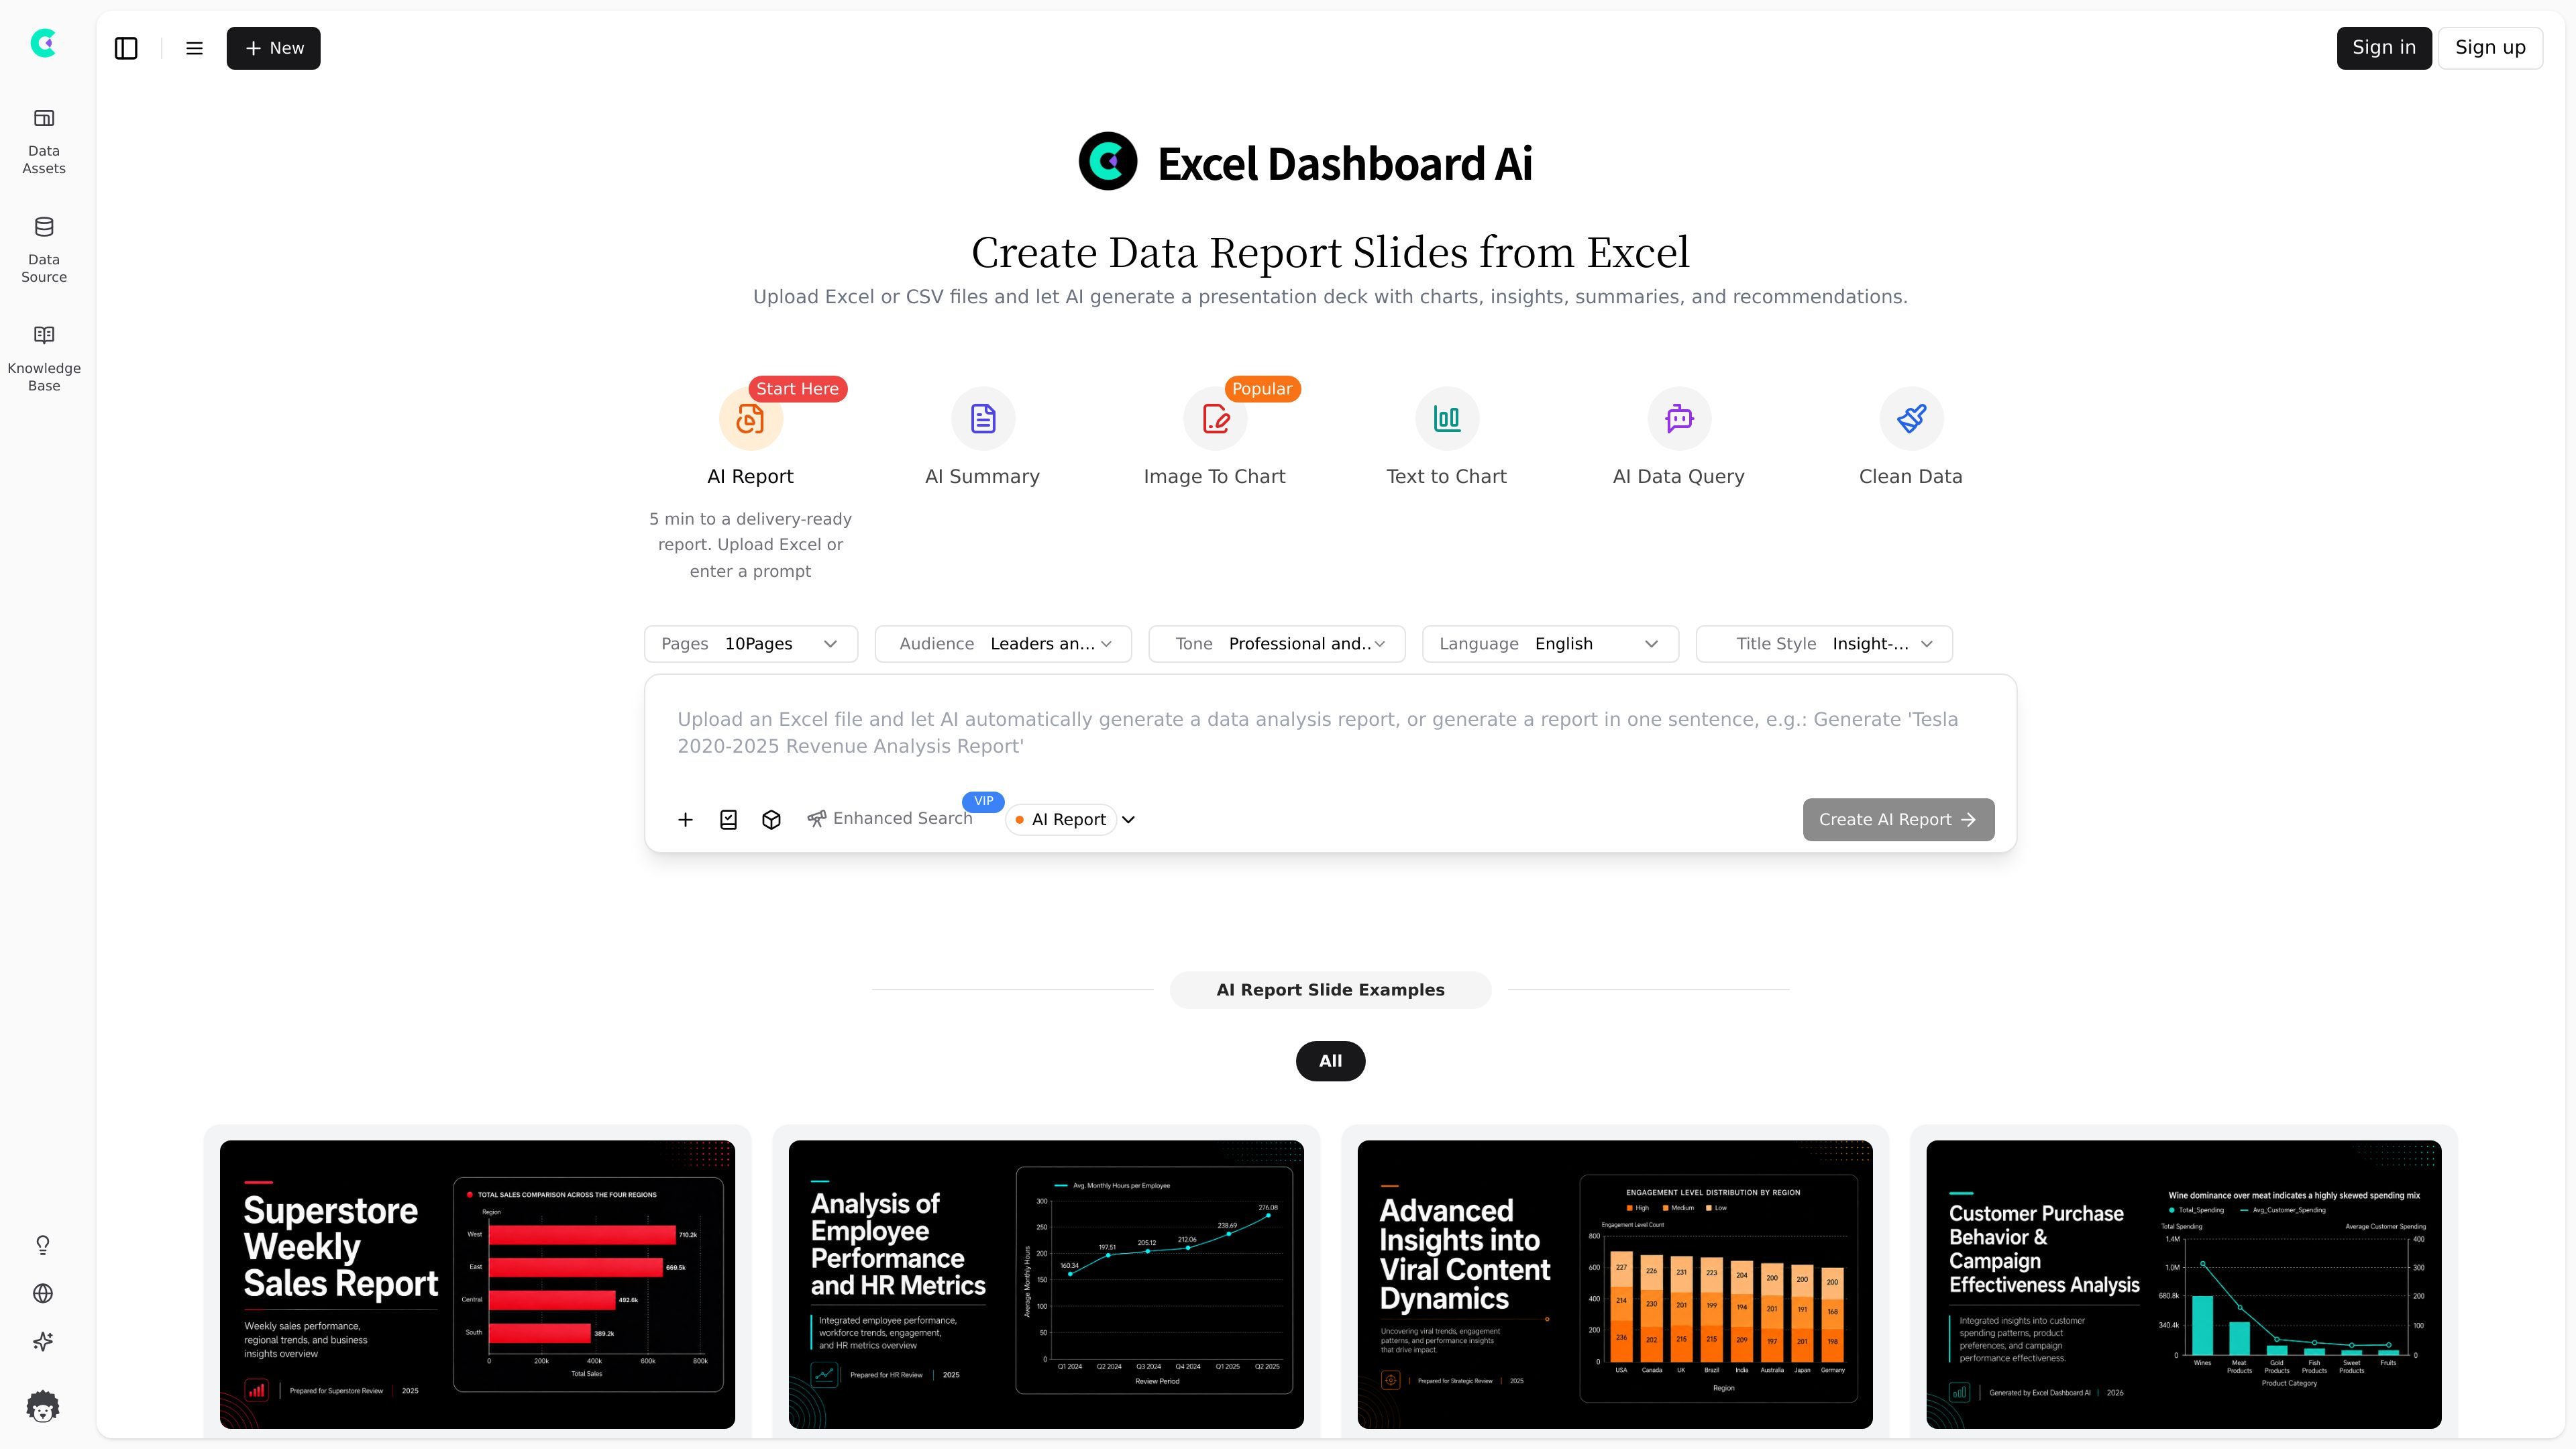
ExcelDashboard Ai is a web-based AI product for turning Excel or CSV data into report decks, dashboards, and analysis summaries. The homepage positions it as a way to upload spreadsheet data and let AI generate a presentation deck with charts, insights, summaries, and recommendations.
The product centers on a report-building workflow rather than a general spreadsheet editor. Its interface shows options for AI summary, chart conversion, data queries, cleaning, audience and tone settings, and PowerPoint export, which makes it useful for people who need to turn tabular data into presentation-ready output quickly.
Upload Excel or CSV files and have the system generate a presentation-style report from the data, including charts, insights, summaries, and recommendations.
Use the report workflow to create delivery-ready output in roughly five minutes according to the homepage, with a simple start flow from upload or prompt.
Work with report-focused helpers such as AI Summary, Image to Chart, Text to Chart, AI Data Query, and Clean Data to shape the output from your data.
Choose presentation settings such as audience, tone, language, and title style, which suggests the report can be tuned for the intended reader.
Export output to PowerPoint on paid plans, making the generated report usable as a slide deck rather than only an on-screen dashboard.
Manage supporting inputs through sections for data assets, data source, knowledge base, and data guidelines, which indicates a structured report-building workspace.
Turn a spreadsheet into a polished report deck when you need charts, summaries, and recommendations without building slides manually.
Prepare a recurring business update, such as sales, operations, or HR reporting, using the report templates and AI chart generation flow.
Convert raw data into a clearer narrative for leaders or clients by setting the audience, tone, language, and title style before export.
Use the data query and clean data tools to explore spreadsheet content and make the source data easier to report on.
Generate chart-based outputs from text or image inputs when the report workflow needs visual structure instead of a table-only summary.
Yes. The pricing page shows a free tier and paid plans, with higher tiers adding more AI credits, more file uploads, and removal of the “Made with ExcelDashboardAi” badge.
The homepage says you can upload Excel or CSV files and let AI generate a presentation deck with charts, insights, summaries, and recommendations. The report area also shows separate sections for data assets, data sources, knowledge base, and data guidelines.
The source pages support Excel and CSV uploads. The pricing page explicitly lists upload limits by plan, and the report page shows the product working around uploaded data assets.
The product appears suited to individual users and teams that need AI-generated reports from spreadsheet data, but the source does not give a detailed collaboration or workspace model.
The visible sources do not describe a desktop app, browser extension, or native mobile app. The product is presented as a web-based service.