
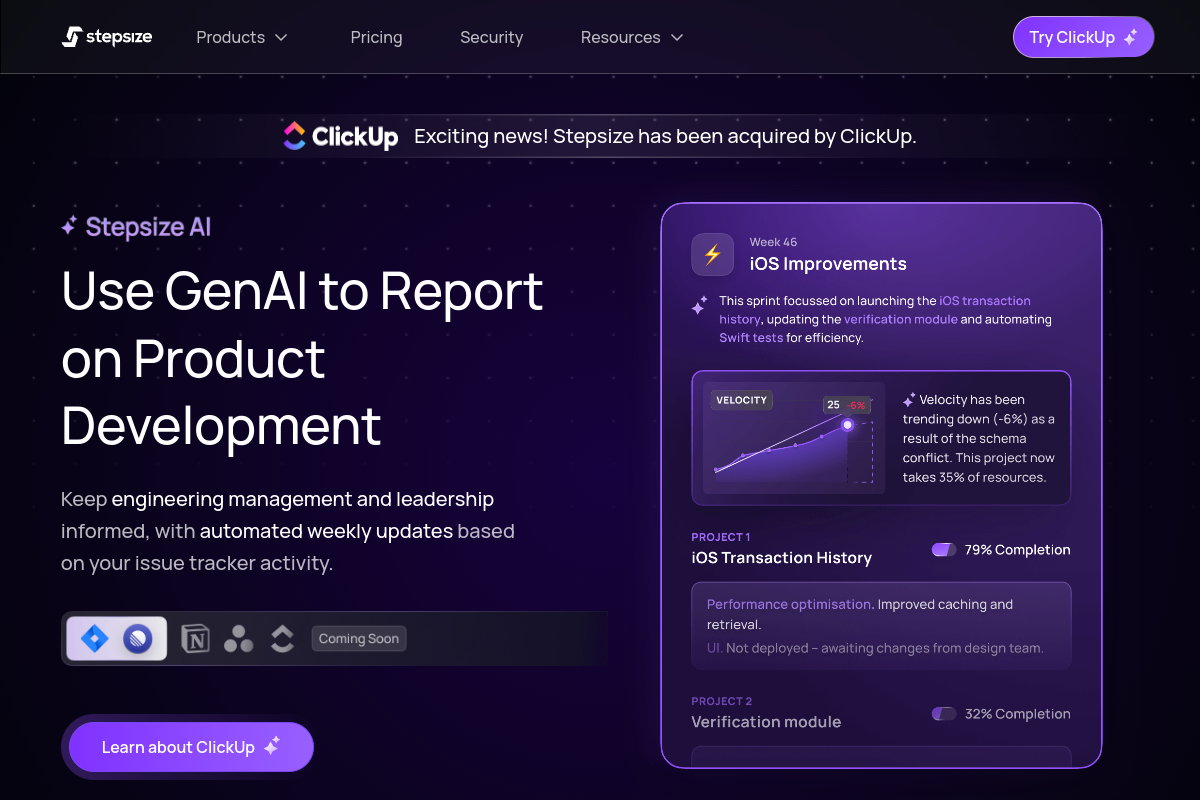
Automated reporting
Turns issue tracker activity into weekly or project-level reports with metrics and plain-language commentary, so readers can understand what changed without assembling updates manually.

Stepsize AI transforma a atividade do Jira ou Linear em relatórios, gráficos e comentários para equipes de engenharia, com fluxos de trabalho para dívida técnica e controles de privacidade.
Stepsize AI is a reporting product for software teams that turns Jira or Linear activity into automated dashboards and written updates. Its stated purpose is to keep engineering management and leadership informed with metrics, charts, and AI-generated commentary based on issue tracker data.
The product is positioned around reducing manual status reporting. The home page describes instant insights, zero setup, and tailored outputs for teams and projects, while the AI pricing page lists report types such as daily standups, team syncs, sprint reports, kanban reports, and executive summaries. Stepsize also shows a separate technical debt product with issue-tracking workflows for teams that want to capture and prioritize debt before moving it into Jira.
Security and data handling are part of the product story. Stepsize says customers can choose which channels, projects, and repositories are included in updates, that their data is not used to train AI models, and that AES-256 encryption is used at rest and in transit.
Turns issue tracker activity into weekly or project-level reports with metrics and plain-language commentary, so readers can understand what changed without assembling updates manually.
Pairs charts and metrics with AI-written context, helping teams interpret progress, sprint themes, and goals instead of reading raw tracker data alone.
Surfaces delivery risks and practical suggestions based on the activity it sees, so teams can spot issues earlier and adjust course.
Lets users choose which channels, projects, and repositories feed the updates, giving teams control over the scope of the reports they receive.
Highlights work at different levels, including team progress, project-level insight, and executive summaries, so the output can serve both delivery teams and leadership.
Use automated weekly updates to keep engineering management and leadership informed without asking teams to prepare manual status reports.
Turn Jira or Linear activity into concise standup or team-sync output so collaborators can follow progress and blockers quickly.
Generate sprint and kanban summaries that combine metrics with commentary, making it easier to review delivery progress and themes.
Surface delivery risks and project themes from tracker structure and activity so teams can respond before issues grow.
Use the technical debt workflow to capture debt from engineers’ editors, prioritize it, and move it into Jira once it is ready to be worked on.
Stepsize AI uses issue tracker activity to generate reports and commentary for Jira boards or Linear teams. The source pages also describe use cases such as daily standups, team syncs, sprint reports, kanban reports, and executive summaries.
The source says Stepsize AI integrates with Jira or Linear, and its security page also mentions Slack and GitHub integrations. The AI product pricing page describes pricing per Jira board or Linear team.
The home page says the product provides instant insights with zero setup, while the AI pricing page offers a 2-week free trial and says you can generate your first update for free without card details.
Stepsize says your data is not used to train AI or any large language models, and that you can choose exactly which channels, projects, and repositories are included in updates. It also says AES-256 is used for encryption at rest and in transit.
The pricing page shows a free plan for Technical Debt and paid plans for Stepsize AI are listed per Jira board or Linear team, with tailored setup available for larger teams. The sources do not show every possible billing detail for all plans.
Os dados de tráfego são apenas para referência.

graphy.app
Graphy é uma ferramenta web de criação de gráficos que transforma dados de planilhas, arquivos, APIs ou buscas com AI em gráficos e dashboards compartilháveis, ideais para visuais de marca, relatórios rápidos e experiências incorporáveis.

autoplot.ai
Autoplot é um app nativo para Mac de gráficos e análise científica que transforma dados tabulares em gráficos, ajustes e resultados reutilizáveis. Oferece suporte a fluxos de trabalho locais, exportações prontas para publicação e preparação de dados com assistência opcional de AI.

formulabot.com
Análise de dados com IA para perguntas, gráficos, planilhas e relatórios

pandada.ai
Pandada AI é uma ferramenta de análise de dados baseada no navegador para limpar arquivos, fazer perguntas e criar gráficos ou relatórios. Compatível com formatos comuns de documentos e planilhas, oferece um plano Basic gratuito e um nível Plus pago.

excelmatic.ai
Ferramenta de análise de planilhas com IA no navegador que transforma Excel, CSV, tabelas PDF e capturas de tela em gráficos, painéis, resumos e relatórios revisáveis.

gitmind.cn
GitMind é um espaço de trabalho com IA para mapas mentais e diagramas que transforma textos, ficheiros, páginas web, áudio, vídeo e imagens em resumos estruturados, mapas mentais, fluxogramas e outros conteúdos visuais. Está disponível na web, desktop, dispositivos móveis e como extensão do Chrome para aprendizagem, planeamento, pesquisa e documentação.