
Interactive data visualization
Upload data or use open datasets to create customizable interactive visualizations, then publish or embed them. The platform supports chart creation as part of a broader data-story workflow.

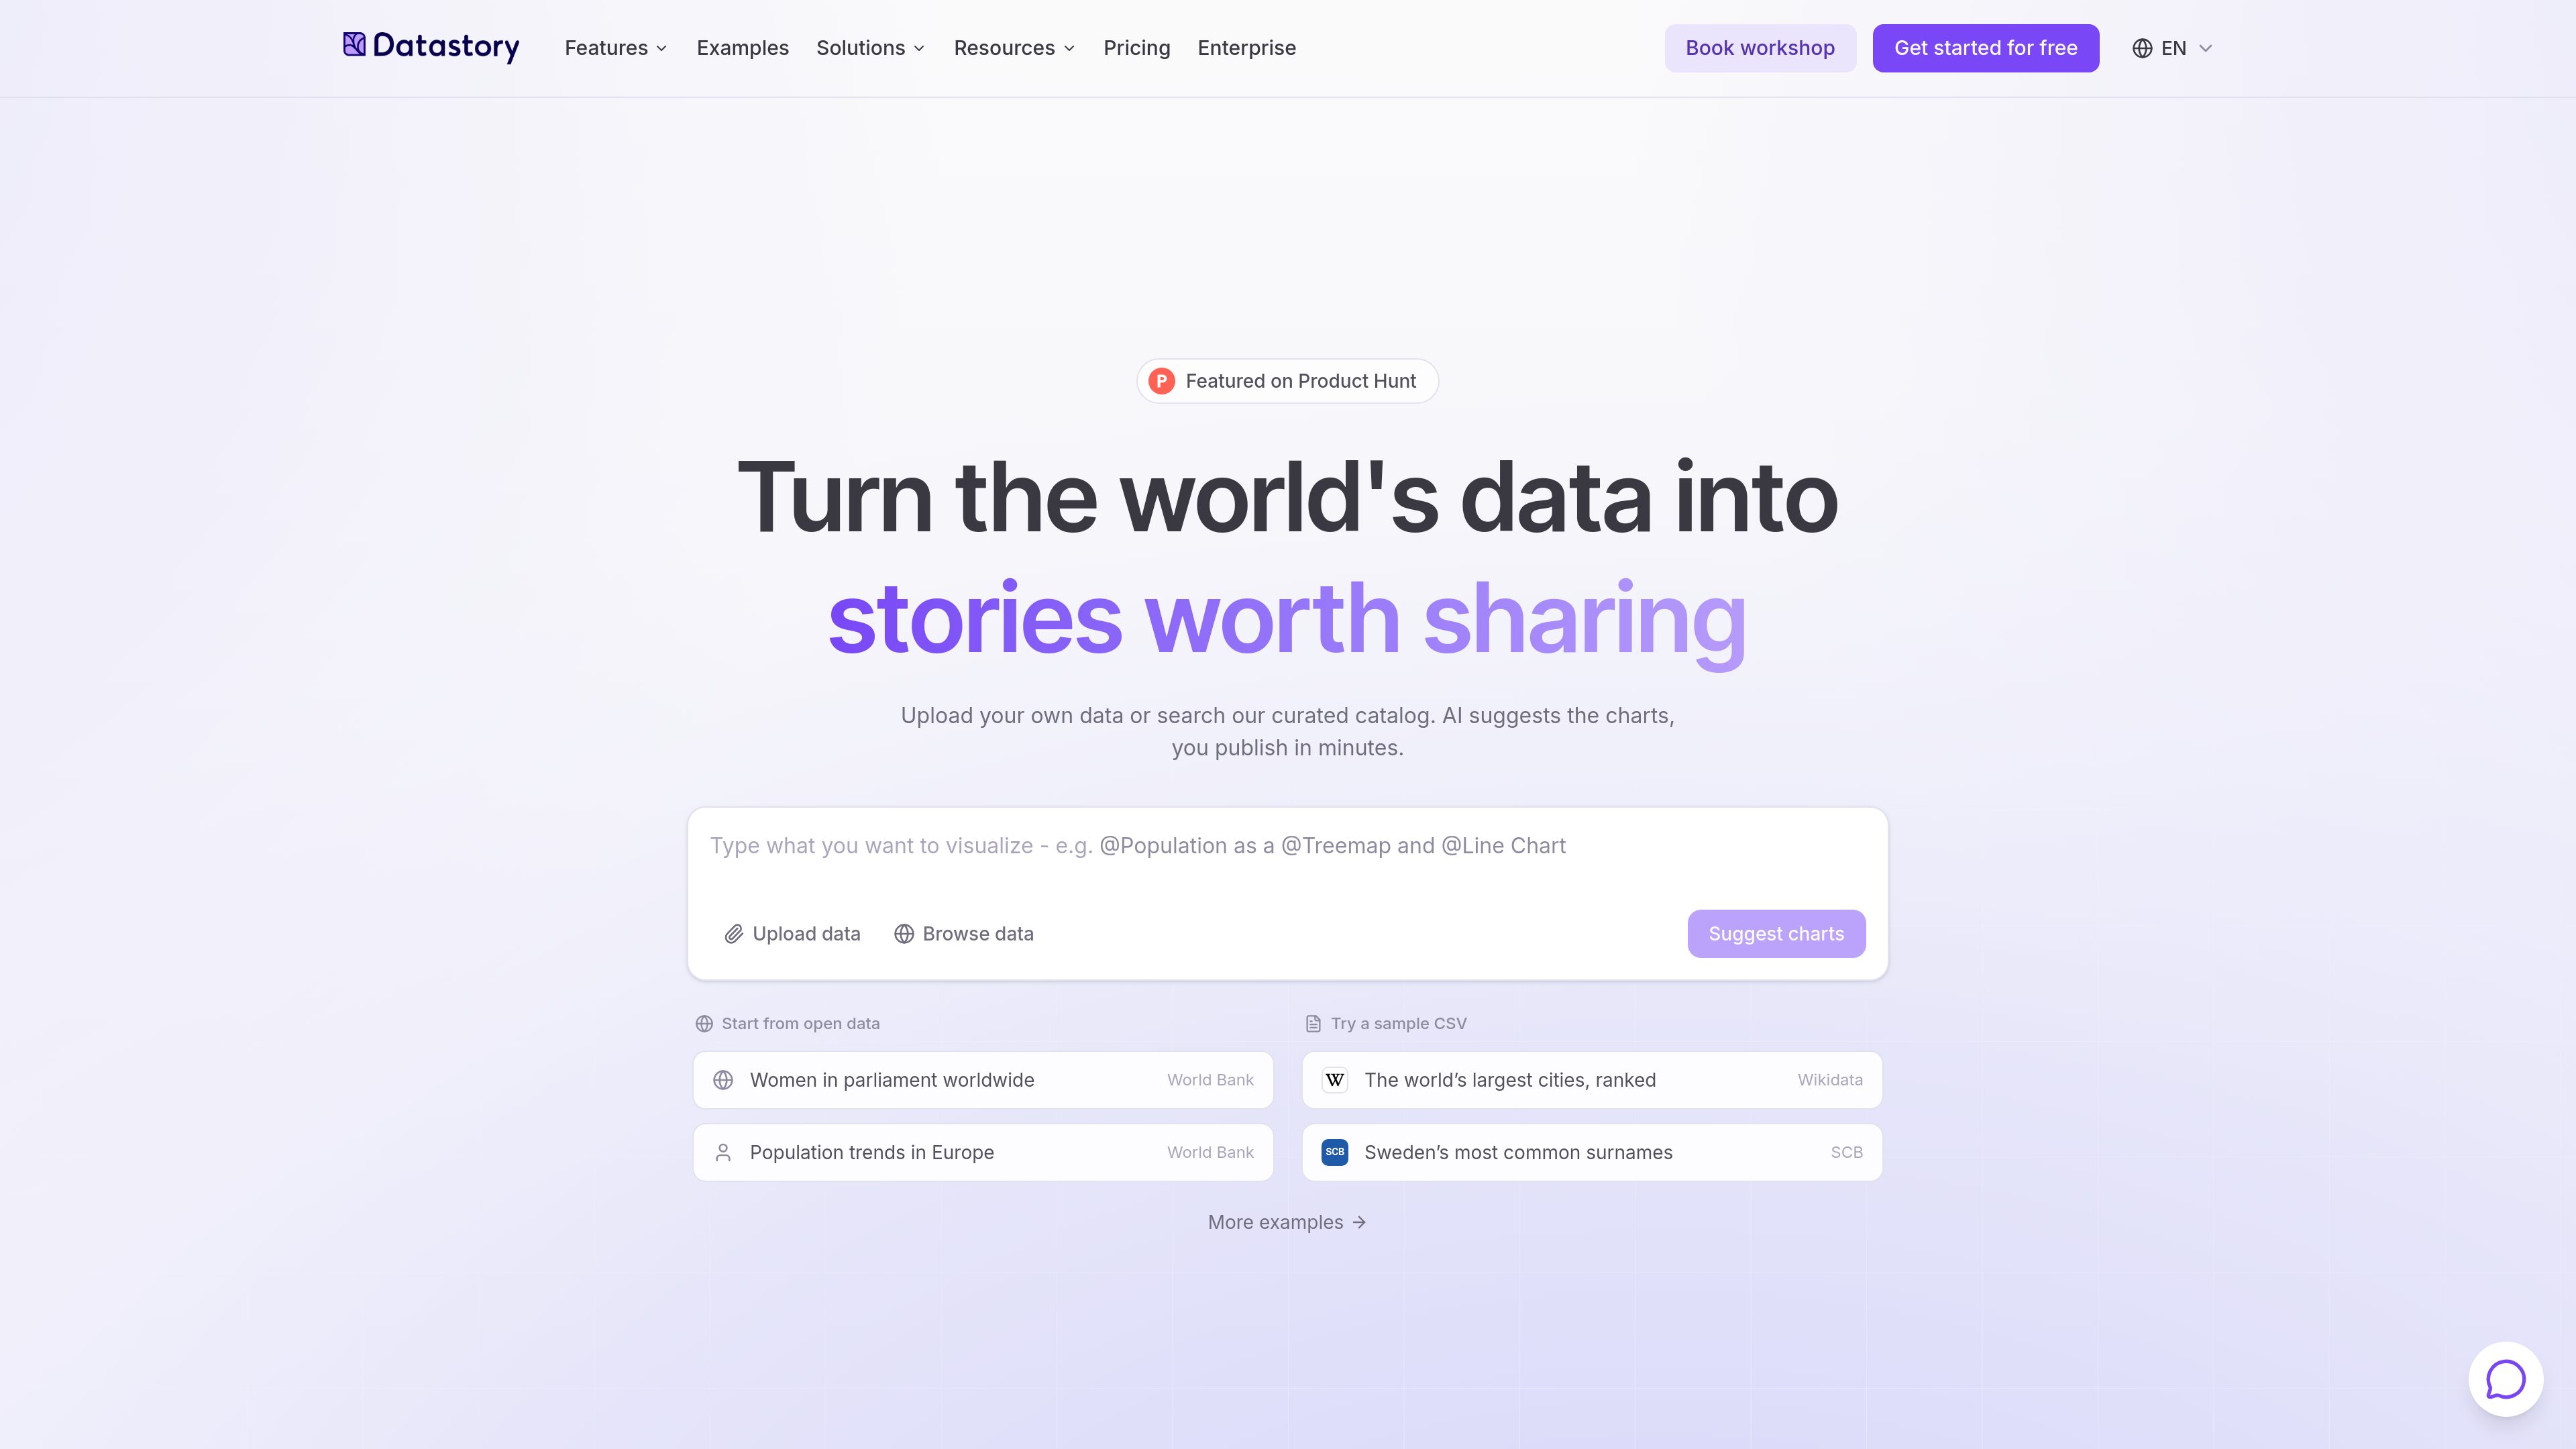
Datastory is a no-code platform for creating interactive data visualizations, websites, reports, and AI-assisted insights. It is designed for data storytellers, analysts, researchers, journalists, and teams that need to turn structured data into publishable content.
Datastory is a no-code platform for creating and publishing data stories. It combines interactive data visualization, an Open Data catalog, AI-assisted analysis, and publishing tools for charts, websites, reports, dashboards, and embeds.
Users can upload their own data or use Datastory’s Open Data resources, customize visualizations, and turn findings into editable stories. The AI features accept plain-English questions, generate charts and draft story structures, and cite the source rows or tables behind supported claims. Datastory also offers linked data as an Enterprise feature for connecting datasets, defining reusable metrics, and organizing relationships in a knowledge graph.
Upload data or use open datasets to create customizable interactive visualizations, then publish or embed them. The platform supports chart creation as part of a broader data-story workflow.
Ask questions in plain English and receive answers with matching charts. Datastory AI can surface spikes, anomalies, trend changes, regime shifts, inflection points, and cross-table correlations.
AI-generated claims are traced to rows or tables in the available data. When the source does not support an answer, the product states that more data is needed rather than presenting an unsupported citation.
A prompt can produce a draft story outline, chart-type suggestions, captions, and an assembled visualization. Outputs remain editable so users can review and refine the result before publishing.
Datastory provides an Open Data catalog for finding, explaining, and visualizing statistics, with the site describing more than 10,000 metrics from over 300 data sources.
Available as an Enterprise feature, linked data brings datasets into a knowledge graph. Teams can define metrics once, document their sources and methodology, model semantic types, and reuse consistent definitions across stories, dashboards, and embeds.
An analyst can upload a table, ask a focused question, generate a chart and draft narrative, then edit the output into a publishable data story.
A newsroom, research group, or public-information team can use interactive charts and the Open Data catalog to explain statistics in a website or embedded presentation.
An Enterprise team can connect metrics and entities from different datasets, then use linked data and AI-assisted discovery to investigate relationships that are not visible in a single table.
Teams sharing dashboards, stories, and embeds can define a metric with its source, unit, description, and methodology, then reuse that definition across outputs.
Organizations that need their own visual identity can use Professional custom logo and theming or Enterprise full white labeling and custom visualizations.
Yes. The Starter plan is listed at $0 per month and includes 10 data visualizations, collaboration with up to three team members, access to the open data catalog, and 100 AI credits per month.
Professional is listed at $15 per month per user. It includes the Starter features plus unlimited data visualizations, removal of Datastory branding, priority support, and 1,000 monthly AI credits.
Yes. Datastory describes a workflow for publishing or embedding visualizations, and its linked-data feature refers to reuse across stories, dashboards, and embeds.
The AI features are designed to ground claims in the available data and cite source rows or tables. If no source supports a requested claim, Datastory says the system reports that limitation and asks for more data instead of inventing a source.
Yes. The plans include collaboration, with three collaborators on Starter and unlimited collaborators on Professional and Enterprise. Enterprise additionally lists data integration and modelling, custom visualizations, full white labeling, a dedicated account manager, and custom AI credits.

visme.co
An AI-powered visual content platform for creating branded presentations, reports, infographics, and more.

infranodus.com
Turn documents, notes and online text into interactive knowledge graphs. InfraNodus reveals topic clusters and gaps, then uses AI to develop questions and ideas from the material you select.