
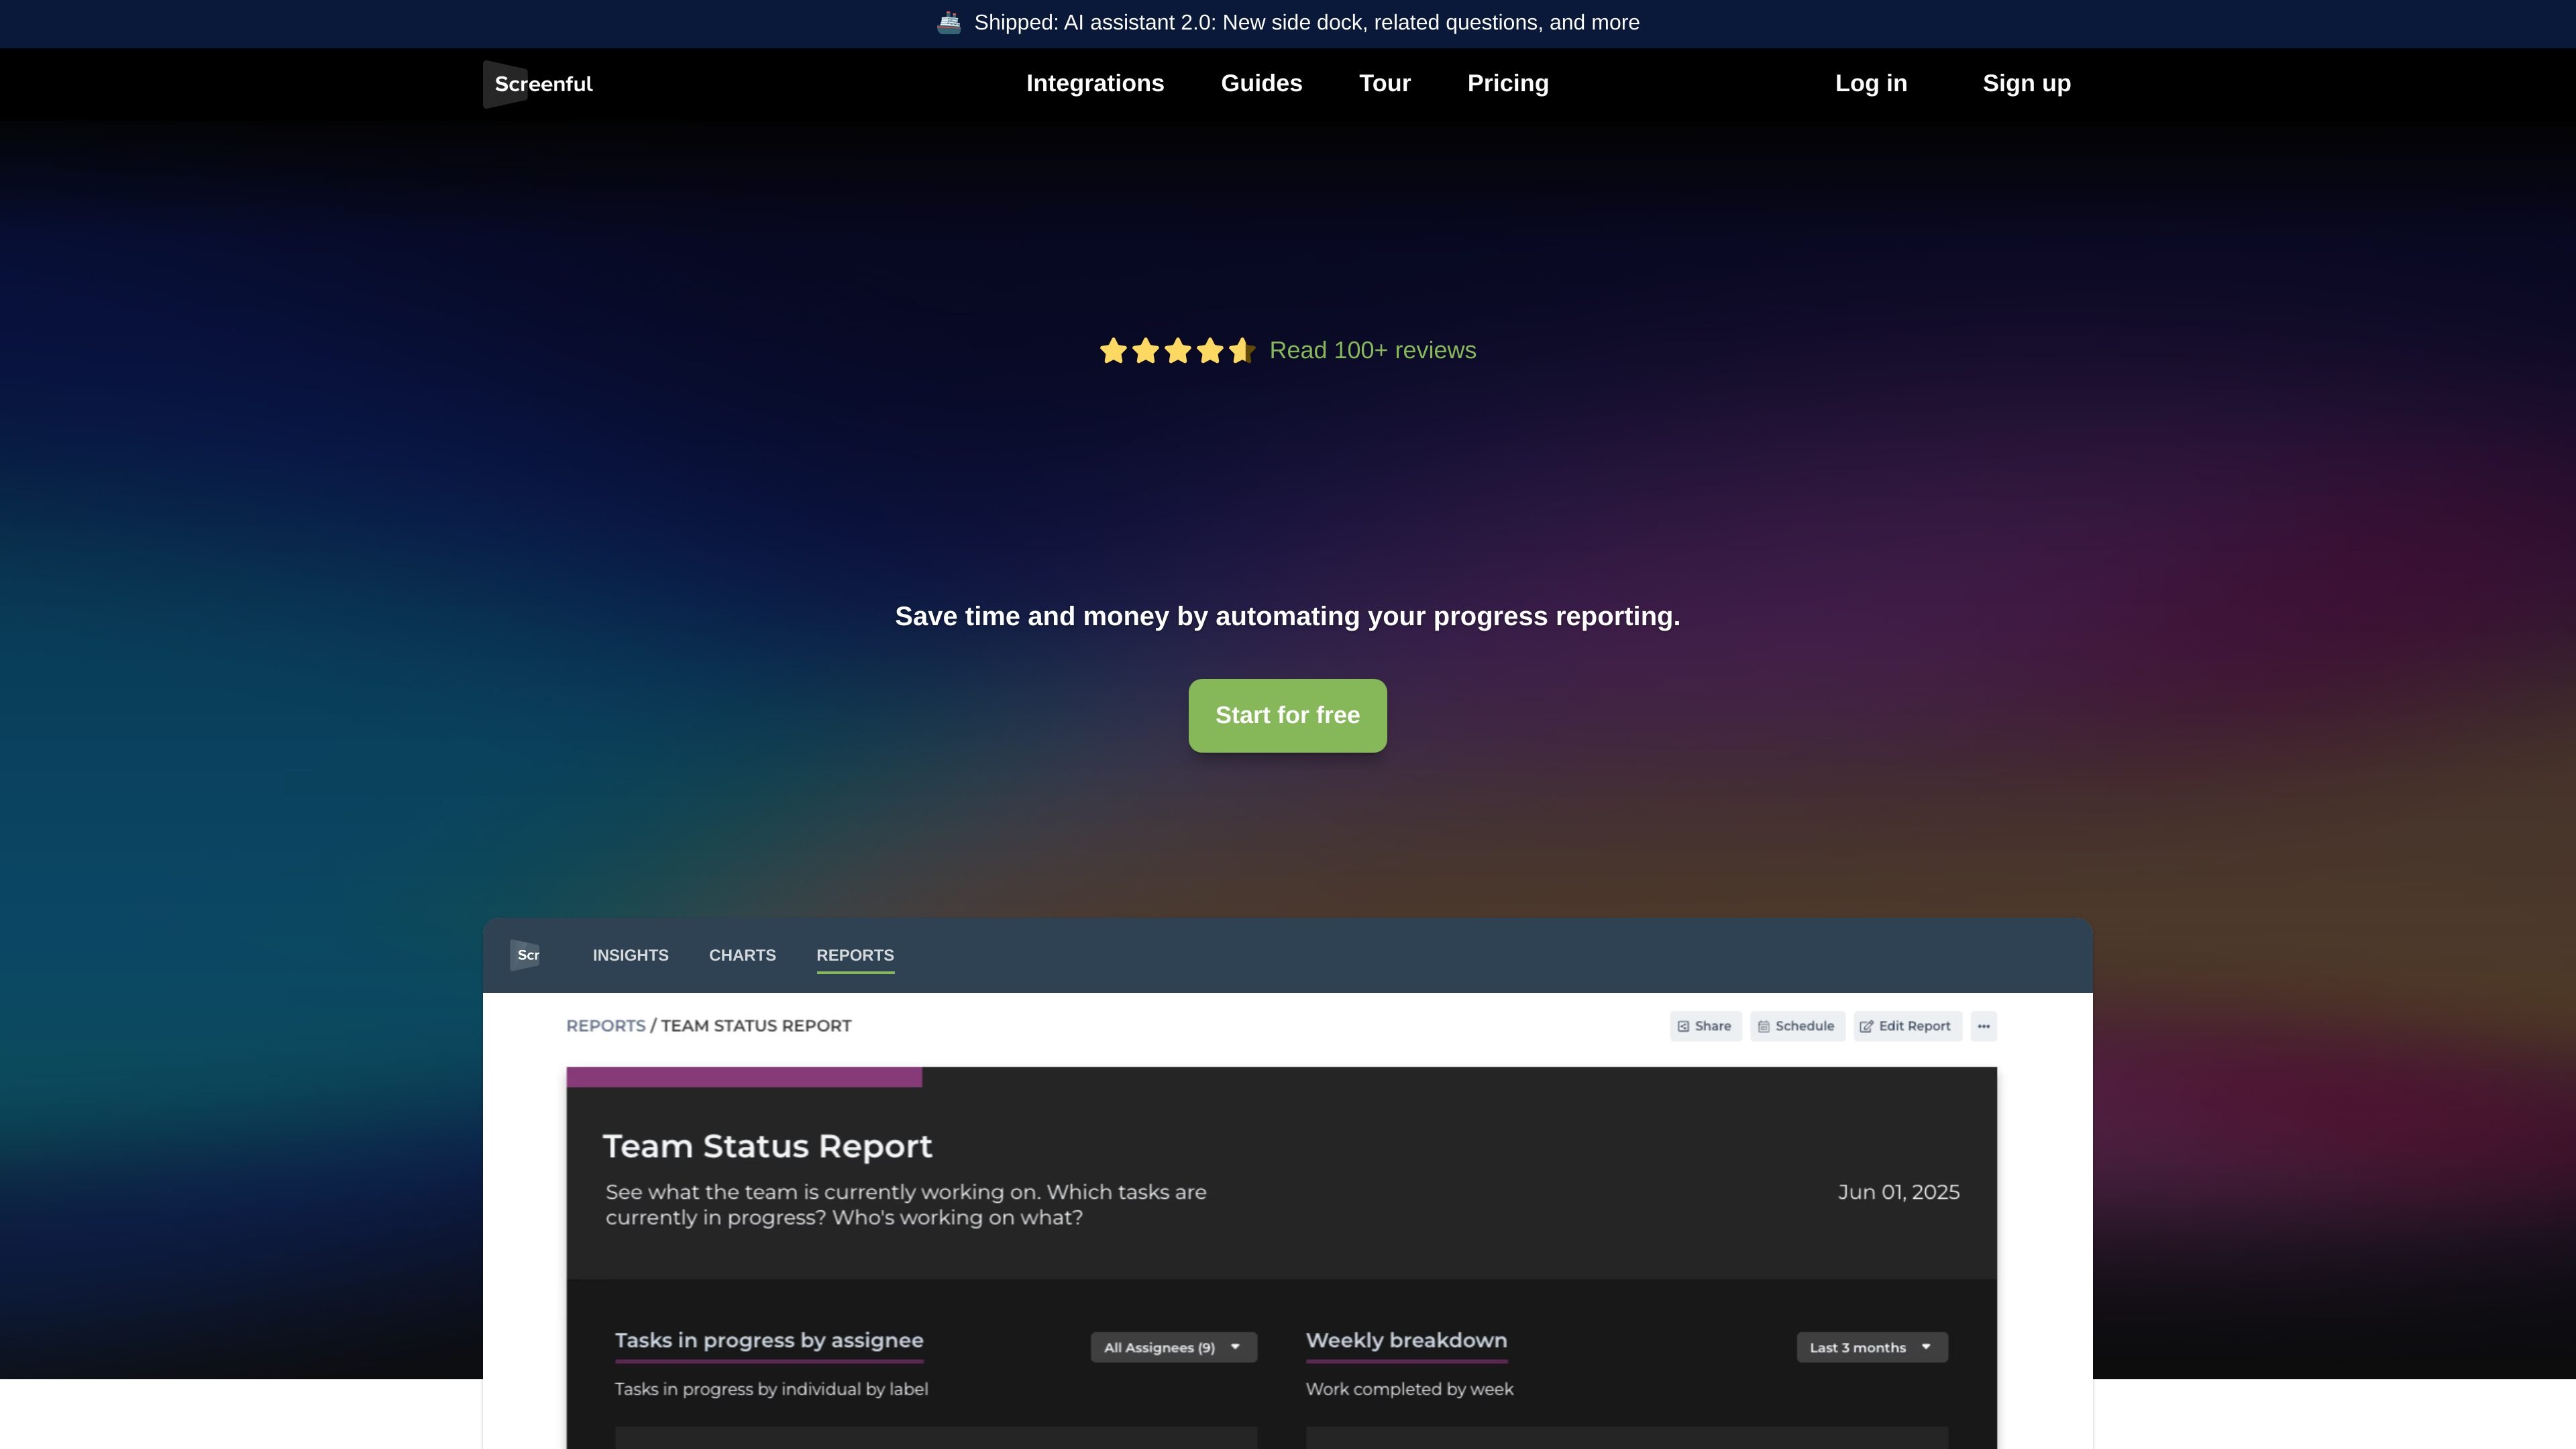
Custom charts and reports
Build custom charts and reports with drag-and-drop tools, templates, and an editor for advanced chart needs.

Screenful turns task-management data from Jira, Trello, Asana, monday.com, GitHub, and GitLab into charts and reports, helping teams track delivery and share updates.
Screenful is a productivity analytics platform for task-management data. It turns data from connected work tools into charts, reports, and scheduled updates so teams can see delivery progress without assembling reports manually.
The product focuses on analytics for workflows such as agile delivery and operational reporting. On the site, Screenful highlights metrics like velocity, throughput, lead time, cycle time, and cumulative flow, plus options to customize charts, share them, and deliver reports by email or Slack.
Build custom charts and reports with drag-and-drop tools, templates, and an editor for advanced chart needs.
Track velocity, throughput, lead time, and cycle time for a team or an entire organization.
Share charts and reports through public or private links, embed them on a website, or send them on a schedule.
Connect task data from supported platforms such as Jira, Trello, Asana, monday.com, GitHub, GitLab, and others named on the site.
Use the built-in AI assistant and keep reporting workflows in one product alongside charts and reports.
Use Screenful to turn work-item data into regular progress reports without assembling charts manually each week.
Track velocity, throughput, lead time, and cycle time across a team or department to monitor delivery flow.
Share charts with stakeholders through links, embeds, or scheduled email and Slack delivery for recurring updates.
Combine multiple task sources into a single reporting workflow when work is spread across different tools.
Screenful loads tasks and task history from connected data sources, and charts can include all tasks in every plan. Historical trend charts are limited by the plan’s data-history allowance, such as 12 months on Starter or unlimited history on Scale and Enterprise.
Plans are recurring and include a 14-day free trial with no credit card required during the trial. You can upgrade by adding a credit card during the trial, and invoicing is available only on Enterprise plans.
Screenful supports scheduling reports by email or Slack, sharing charts and reports with public or private links, and embedding them on a website.
The pricing page lists unlimited users on all standard plans, while the plan limits are based on the number of data sources, charts, reports, and historical data allowed.
Traffic data is for reference only.

tableau.com
Tableau is a business intelligence and visual analytics platform that helps people explore data, create visualizations, and share insights. It offers hosted, self-managed, and desktop options for teams that need analytics, governance, and collaboration.

powerbi.com
Microsoft Power BI is a business intelligence and data visualization platform for interactive reports, dashboards, and analytics, with free, paid, and Desktop options.

splunk.com
Splunk unifies security and observability, helping organizations turn machine data into intelligence, investigate threats, monitor performance, and automate responses.

deepnote.com
Deepnote is a collaborative cloud notebook for Python and SQL that helps data teams explore data, build dashboards, and share work in one workspace.

diib.com
diib is an SEO and website growth tool that scans your site, syncs with Google Analytics, and turns performance data into actionable recommendations.