
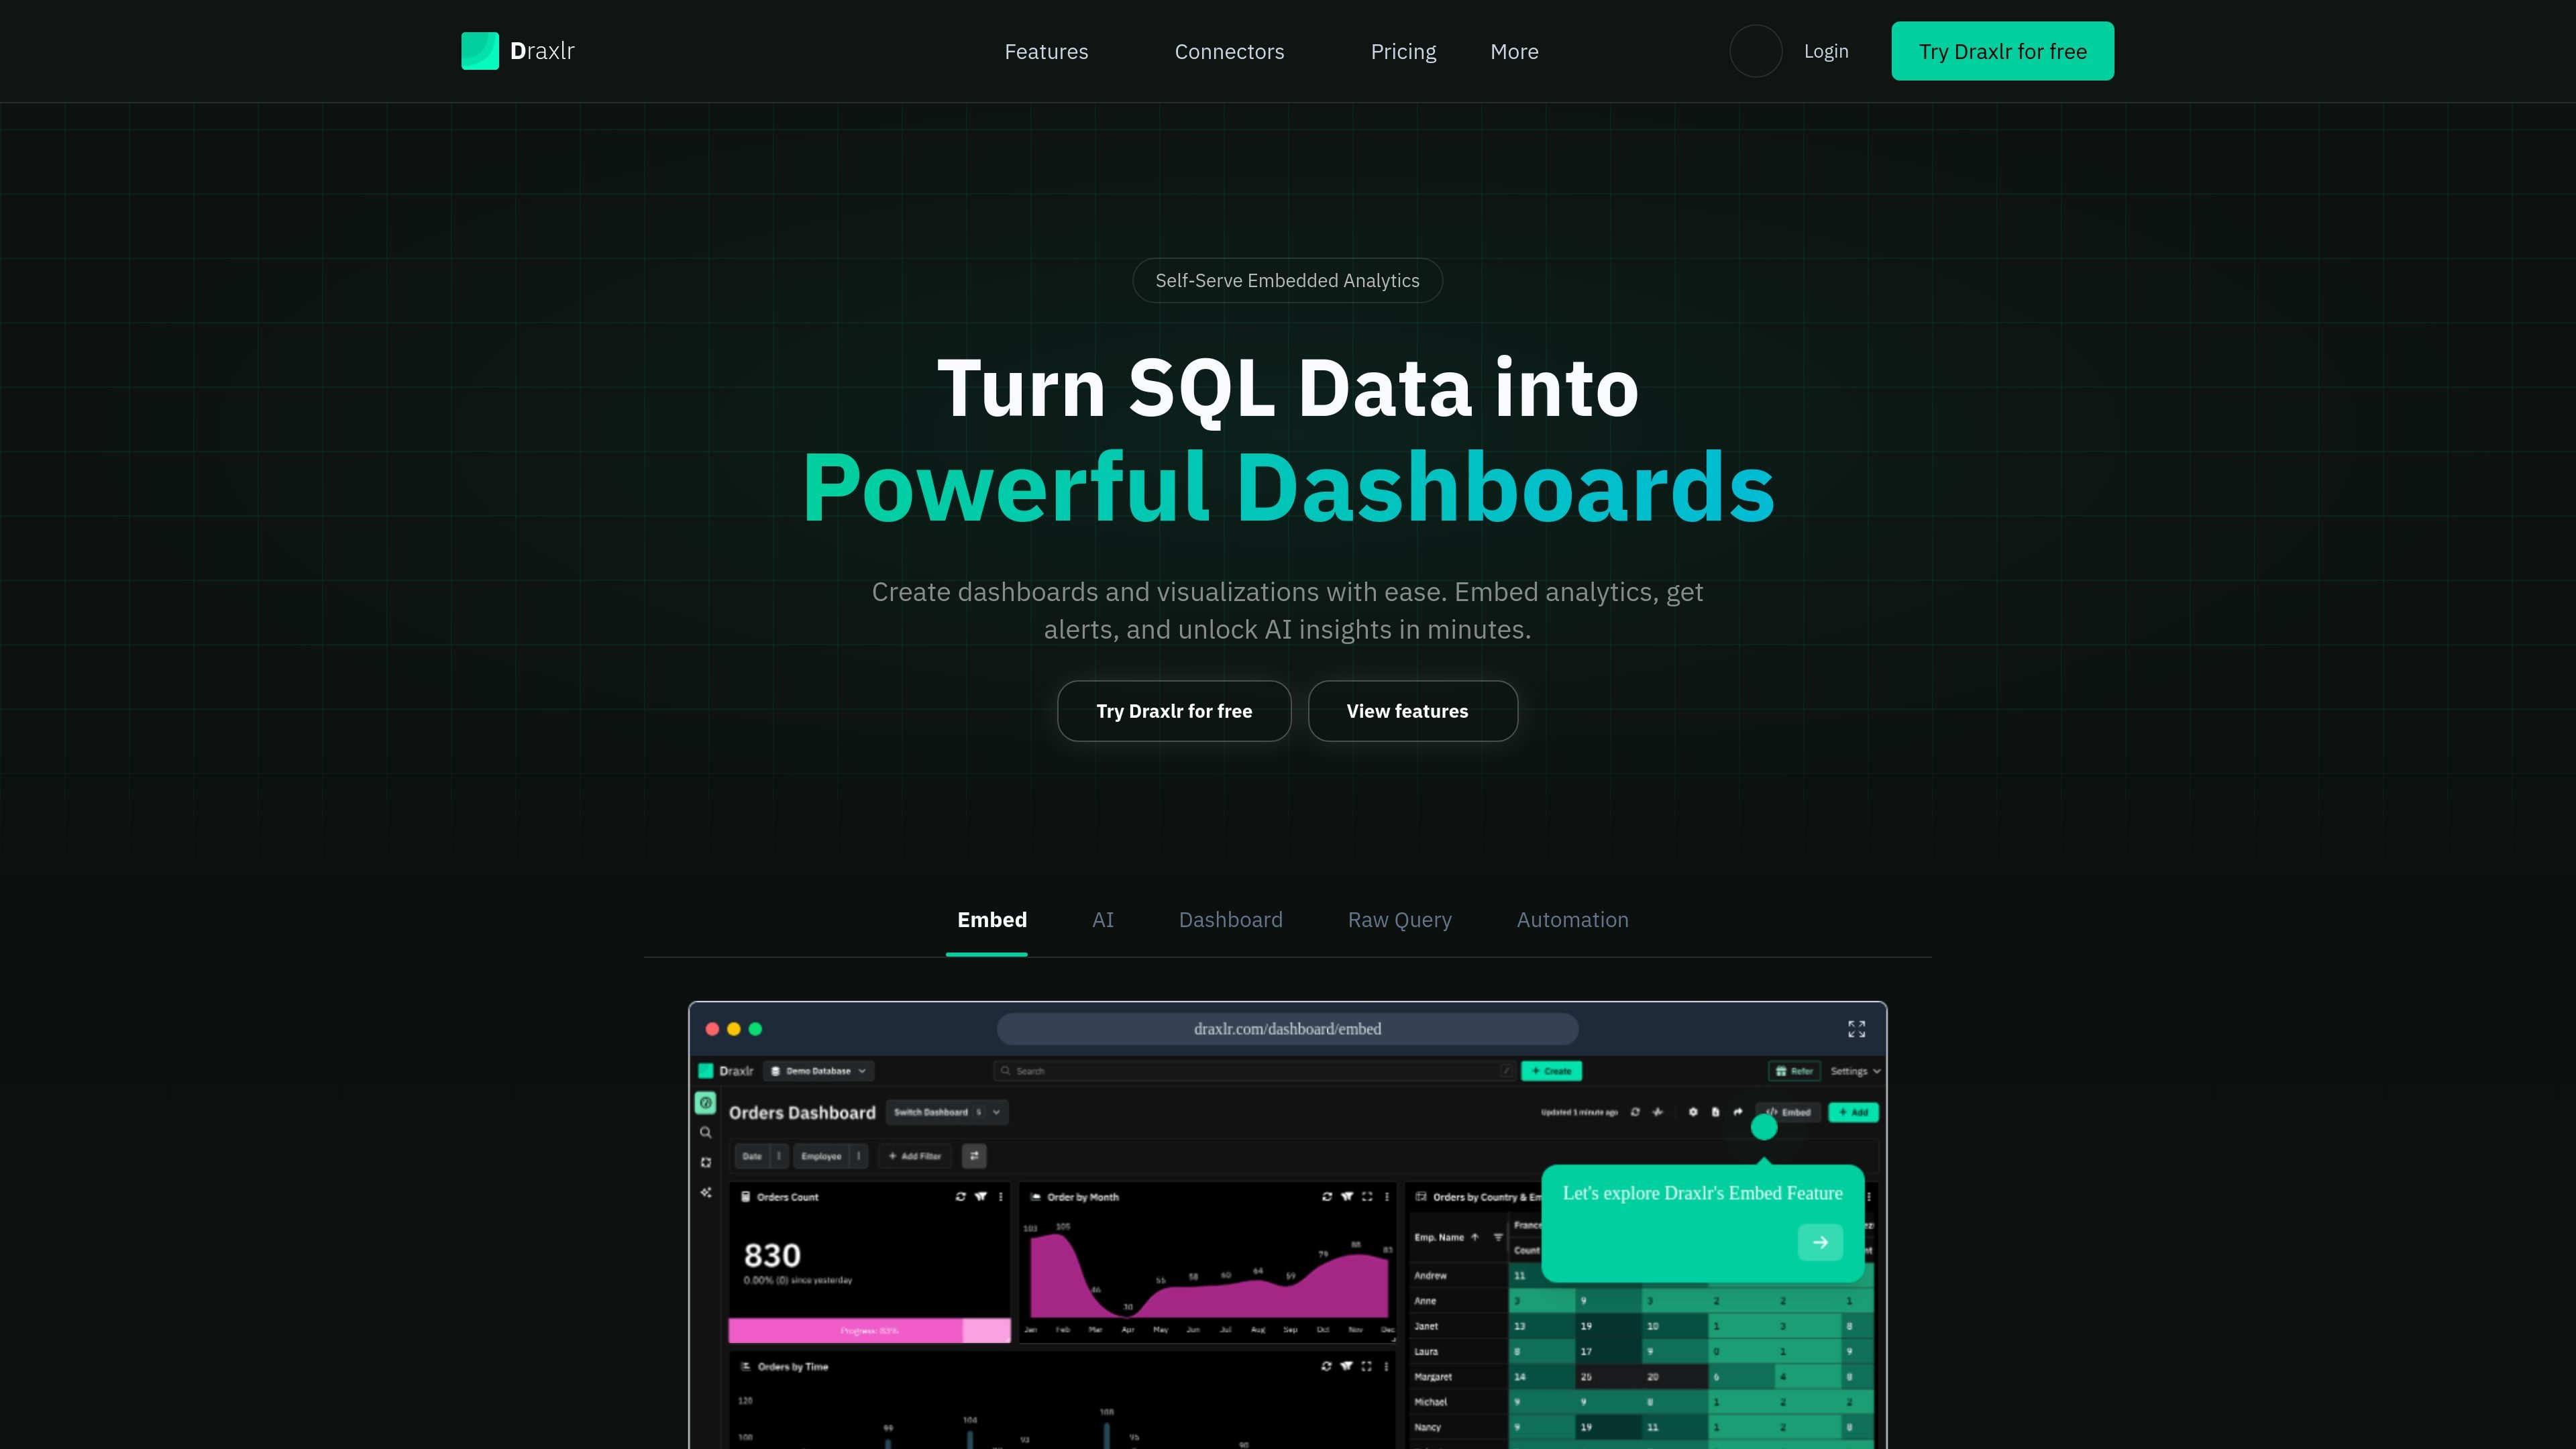
Visual SQL query builder
Build queries by choosing filters, joins, and summaries instead of writing SQL from scratch, with the option to switch into SQL when needed.

No-code BI and embedded analytics for SQL databases
Draxlr is a no-code BI tool for building dashboards, reports, alerts, and embedded analytics on SQL databases. It is designed for teams that want to work from database data without building each reporting workflow manually.
The product supports a query-builder workflow for filtering, joining, and summarizing data, while also allowing users to switch to SQL when needed. It can connect to a wide list of SQL databases, including PostgreSQL, MySQL, MariaDB, PlanetScale, CockroachDB, YugabyteDB, Microsoft SQL Server, Redshift, BigQuery, Supabase, ClickHouse, Databricks, and Snowflake.
Draxlr also includes dashboard embedding features for customer-facing or internal applications, plus alerting and AI-assisted data insights. The site positions the product for founders, operators, product teams, and other users who need accessible reporting on SQL-backed data.
Build queries by choosing filters, joins, and summaries instead of writing SQL from scratch, with the option to switch into SQL when needed.
Use interactive column actions to sort, inspect totals, find minimums and maximums, count distinct values, and view averages based on column type.
Save queries with version history, compare edits, and return to earlier versions when a query changes over time.
Turn query results into dashboards with tables, pivot tables, charts, and computed cards, then organize them into folders and shared dashboard views.
Embed dashboards into web apps using HTML, ReactJS, or VueJS snippets, with options for responsive layouts, white-labeling, and export controls.
Set alerts on reports for email or Slack notifications when data changes, crosses a threshold, or follows a schedule.
Analysts and operators can build filtered, joined, summarized queries without waiting on developers for every report, then save or version those queries as the source changes.
Product teams can embed interactive dashboards into customer-facing apps, customize the presentation, and control filters or exports so each viewer sees the right context.
Operations teams can monitor thresholds or data changes with scheduled alerts sent by email or Slack, helping them respond to events without checking dashboards manually.
Teams using Supabase or other supported SQL databases can turn live database tables into dashboards and reports for internal decision-making.
Organizations that want visual analysis with an escape hatch to SQL can start with clicks, then move into SQL editing when a query needs more control.
Yes. The pricing page says Draxlr offers a 7-day free trial with full access to the Power plan and no credit card is required.
Yes. The site says you can upgrade or downgrade from your account settings.
Draxlr says it accepts credit and debit cards, including Visa, Mastercard, and American Express, and uses Stripe for payment processing.
All plans include access to support via email and live chat, according to the pricing page.
The pricing page says custom plans are available and that extra AI credits can be purchased.
Traffic data is for reference only.
| May | 37397 |
|---|---|
| Jun | 33180 |
| Jul | 32030 |
Traffic analytics are not available yet.
Traffic analytics are not available yet.

supaboard.ai
AI business intelligence for connected data, natural-language queries, and collaborative dashboards

sourcetable.com
AI spreadsheet combining chat analysis with spreadsheet workflows for analysts, operators, and finance teams.

askyourdatabase.com
AskYourDatabase is an AI data analyst and SQL chatbot for querying databases in natural language, with dashboards and access control.

querio.ai
Querio is a data platform for agentic notebooks, embedded analytics, and AI-assisted insights delivered in Slack or products.

basedash.com
Basedash is an AI-native BI platform for connecting data, asking questions, and creating dashboards and reports.

www.basedash.com
Basedash is an AI business intelligence platform that analyzes data, builds dashboards, and works with Excel files both ways for teams.