
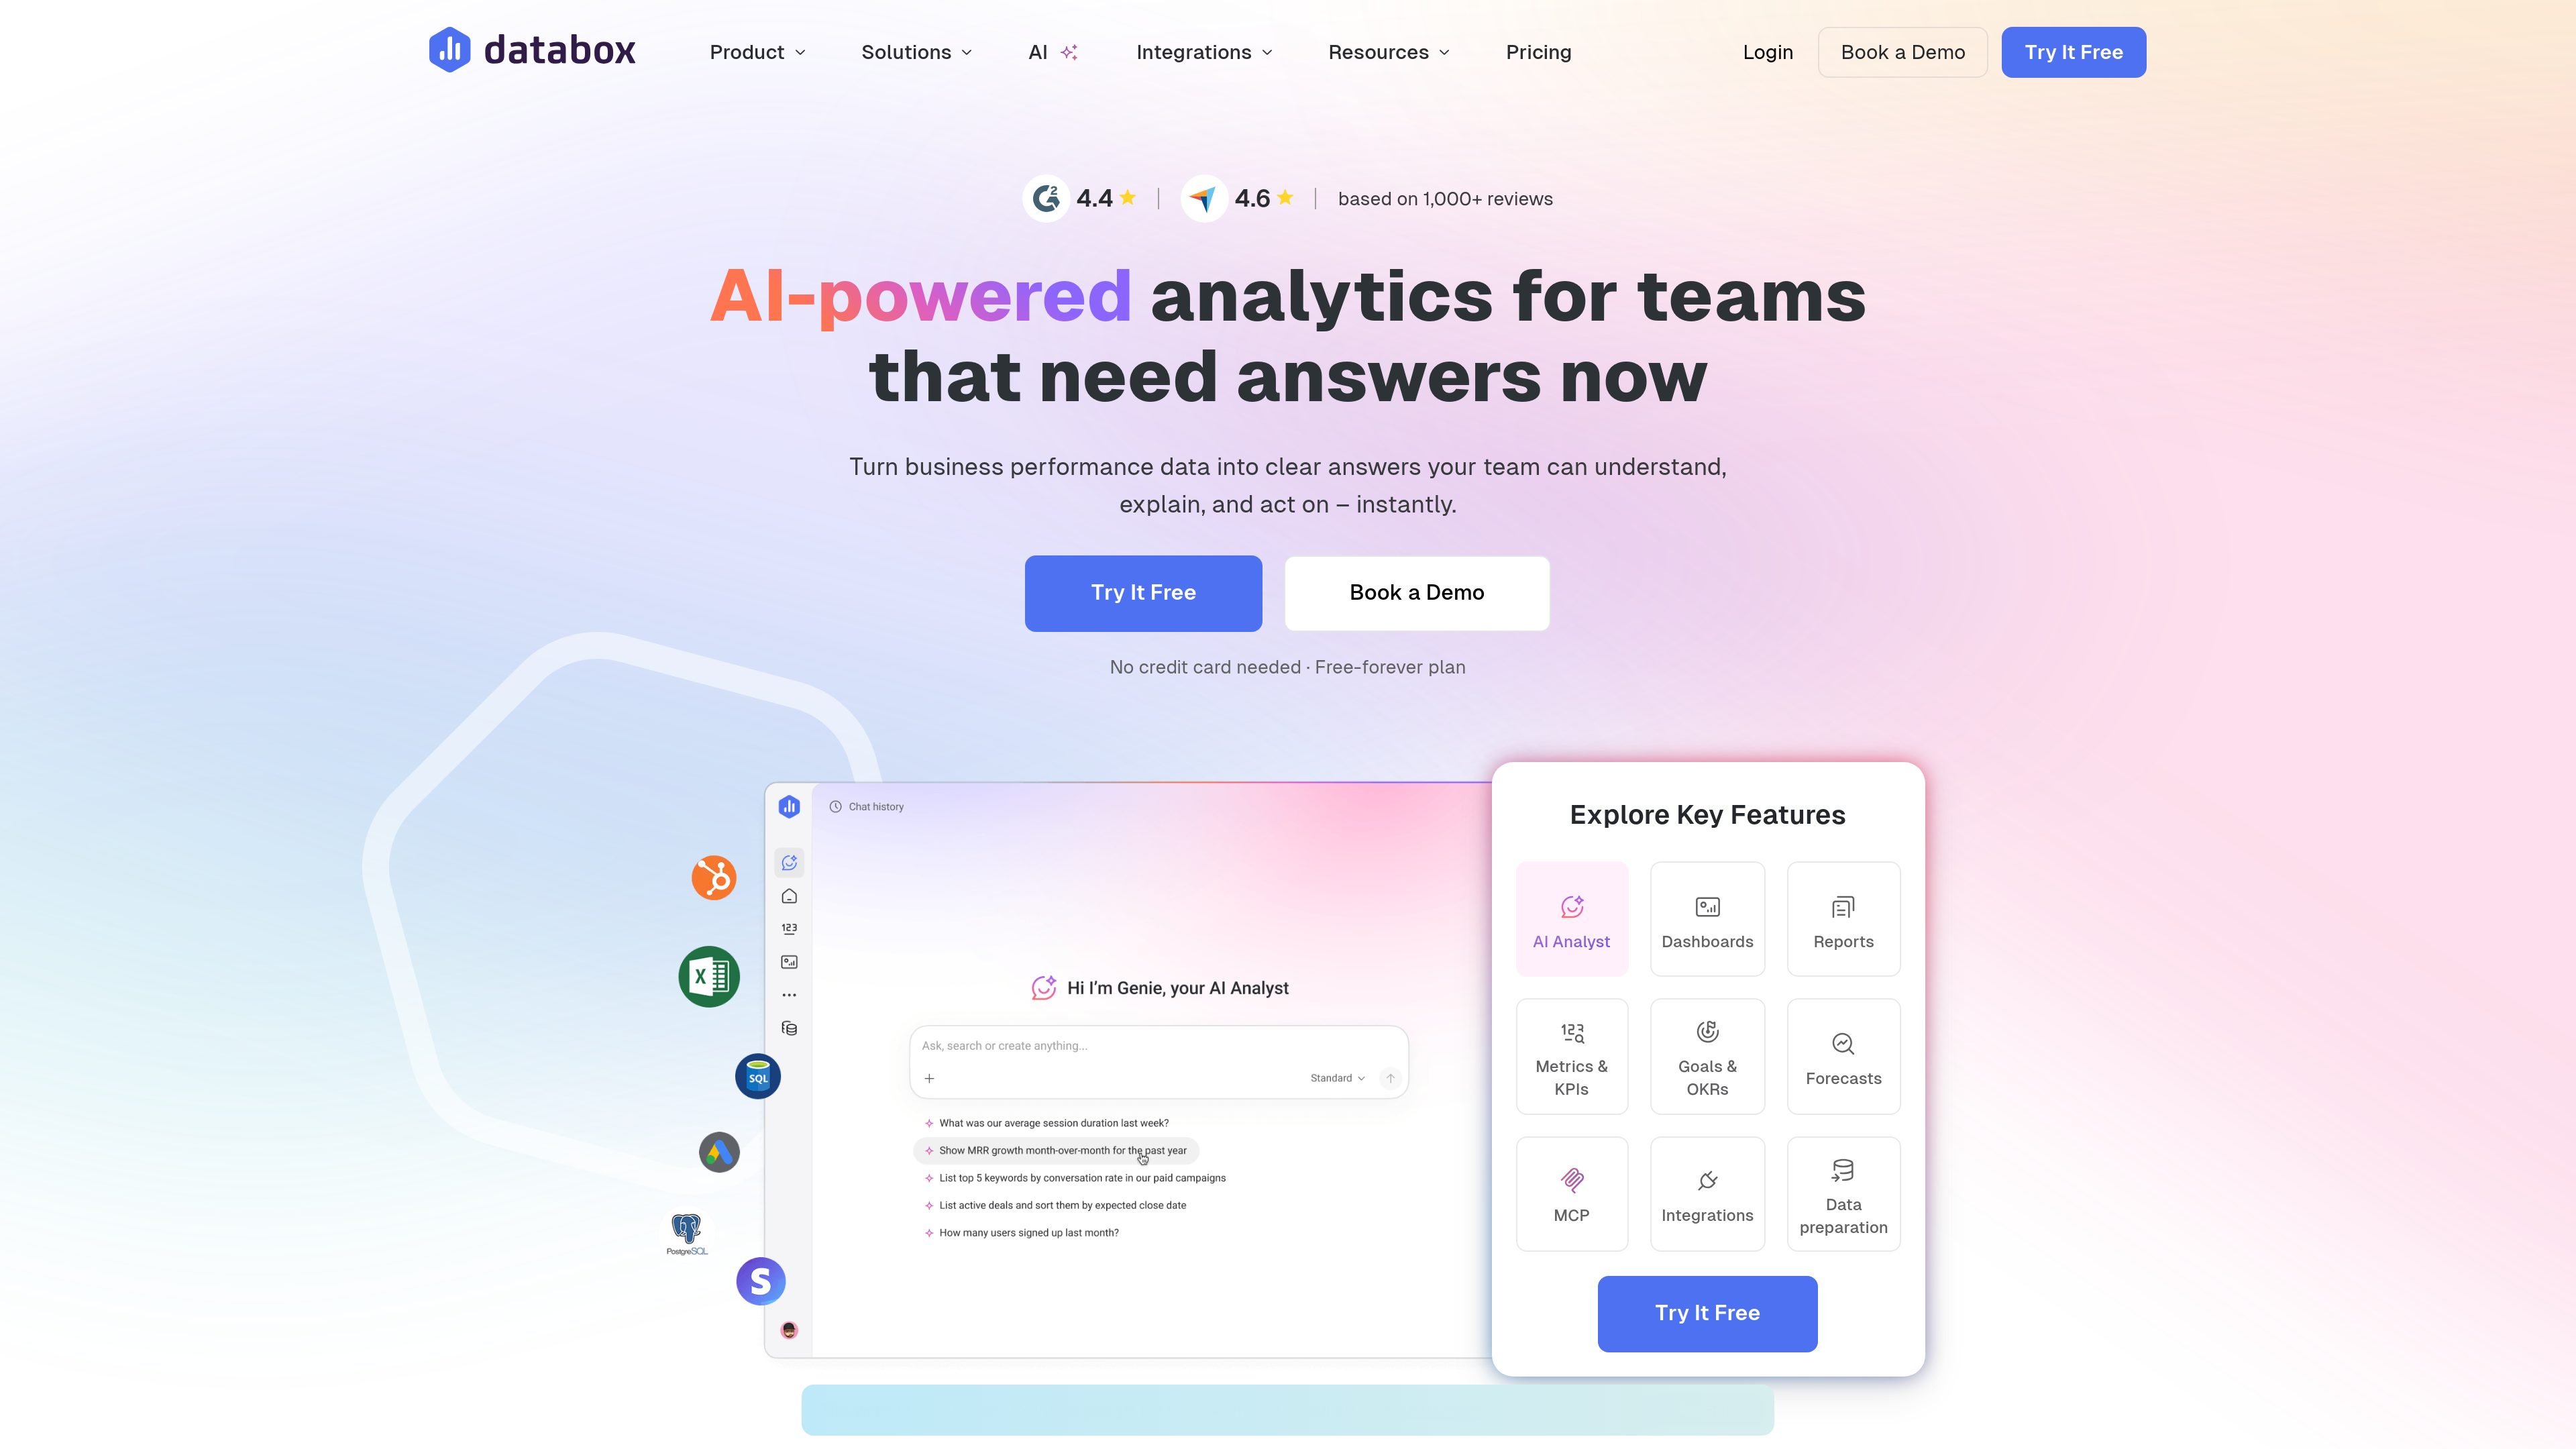
AI Analyst (Genie)
Ask questions in everyday language and get answers grounded in your business data. Genie can also help create metrics and dashboards and explain what is driving changes.

Databox connects 130+ data sources for AI-powered dashboards, reports, and performance insights.
Databox is a business intelligence and analytics platform for teams that need performance data in one place. It combines AI-assisted analysis, dashboards, reporting, metrics management, goals, forecasts, and data preparation so users can move from raw data to answers without switching between many tools.
The product is built around a central data layer that connects 130+ integrations, spreadsheets, databases, warehouses, APIs, and custom data sources. Users can turn that data into dashboards, scheduled reports, curated datasets, and standardized metrics, then share the results with teammates or stakeholders in the format they need.
Ask questions in everyday language and get answers grounded in your business data. Genie can also help create metrics and dashboards and explain what is driving changes.
Pull your most important metrics into interactive dashboards that teams can explore at a glance. Databox includes templates and supports drill-down style performance viewing.
Create scheduled reports that combine live metrics, visualizations, and written context. This helps teams communicate performance without assembling each report manually.
Centralize data from cloud tools, spreadsheets, databases, warehouses, and APIs. Databox also supports datasets for filtering, merging, and calculating row-level data into curated tables.
Standardize KPIs with pre-built metrics, custom metrics, filters, dimensions, calculations, and SQL-backed options. This supports a more consistent metric layer across the account.
Set goals, track OKRs, and build forecasts with scenario planning. The platform also connects performance data to automated summaries and actions through MCP and API access.
Marketing and growth teams can combine campaign and channel data into one dashboard, then compare spend, return, and performance without checking each platform separately.
Sales and revenue teams can track key pipeline and performance metrics in a shared view, making it easier to spot changes and communicate results internally.
Managers can automate recurring reports so stakeholders get updates with live metrics, visualizations, and written context instead of manual slide decks or spreadsheets.
Teams that need self-serve analytics can let non-technical users explore trusted metrics and ask questions in plain language instead of waiting on an analyst.
Operators can set goals, track OKRs, and build forecasts to plan ahead using metric-based targets and scenario thinking.
Databox is designed to connect data from multiple sources and turn it into dashboards, reports, goals, and AI-assisted answers. The site emphasizes use for teams that need performance data in one place.
The pricing page shows a free plan and paid plans, and the home page offers a free trial and a free-forever plan. The Growth plan includes a 14-day free trial.
Yes. The site highlights dashboards, reports, goals & OKRs, forecasts, AI analysis, and sharing options for teams. The free plan is limited, while paid plans expand sources, users, and BI features.
Databox is presented as a business intelligence and analytics platform that connects 130+ data sources, including cloud tools, spreadsheets, databases, APIs, and data warehouses.
The source content does not list full setup steps, but it does say users can connect sources, choose templates, build dashboards, and ask Genie questions in plain language.
Traffic data is for reference only.

datarc.cn
Enterprise AI data insights through natural-language queries

stepsize.com
Stepsize AI turns Jira or Linear activity into reports, charts, and commentary for engineering teams, with technical-debt workflows and privacy controls.

supaboard.ai
AI business intelligence for connected data, natural-language queries, and collaborative dashboards

ignite.no
Ignite unifies procurement and supplier data for smarter decisions

phbench.com
Open benchmark for predicting Series A funding from Product Hunt launch signals

querio.ai
Querio is a data platform for agentic notebooks, embedded analytics, and AI-assisted insights delivered in Slack or products.