
AI-guided incident investigation
HyperProbe can pick up an alert from PagerDuty, Datadog, or Slack, read logs and traces, locate a suspected code path, and plan the debugging flow.

HyperProbe는 실행 중인 애플리케이션 코드에 읽기 전용 프로브를 배치해 변수의 실시간 상태를 캡처하는 AI 지원 프로덕션 디버깅 도구입니다. 재배포나 재시작 없이 로그와 트레이스로 원인을 파악하기 어려운 인시던트를 엔지니어링 및 온콜 팀이 조사할 수 있도록 돕습니다.
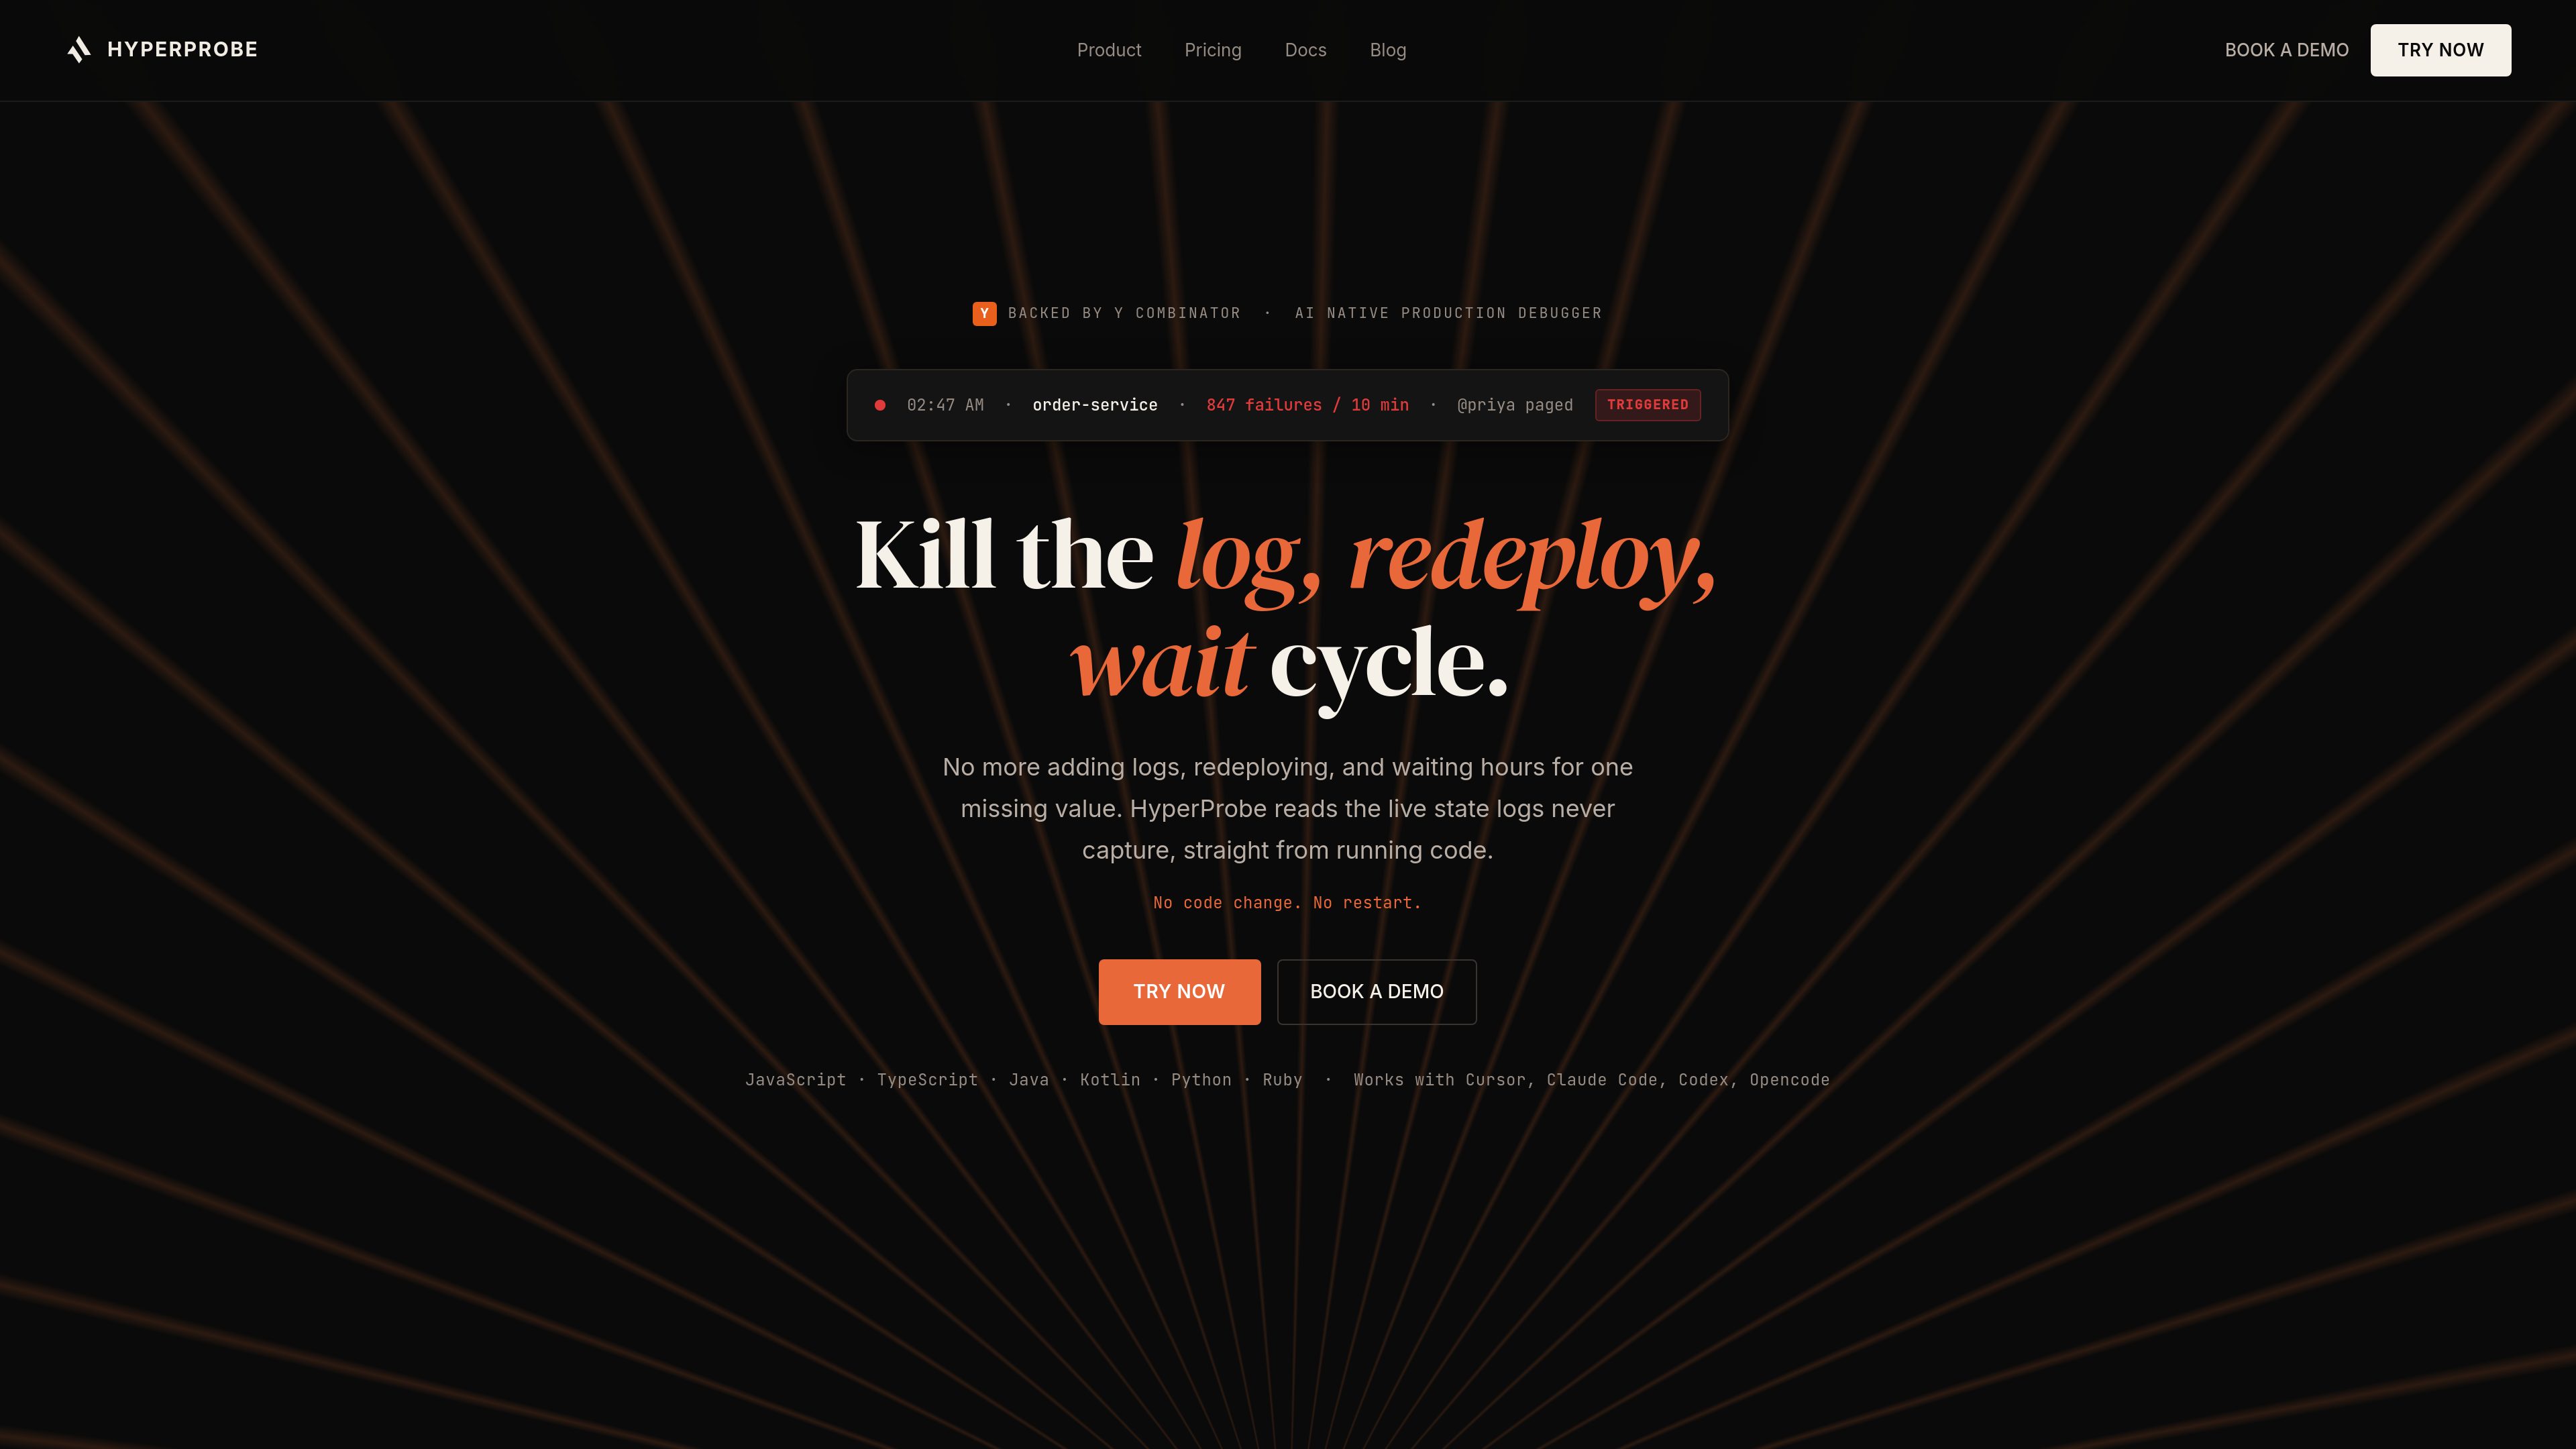
HyperProbe is an AI-assisted production debugger for investigating failures in running applications. It reads logs and traces, identifies a suspected file and line, and places a read-only probe on that code path. When the line is reached by live traffic, the probe captures the variable state at that moment, giving engineers evidence that may not exist in application logs.
The workflow is designed for incidents that are difficult to reproduce or that do not produce a useful exception. Probes are non-blocking and asynchronous: the service continues handling requests, and the probe clears after its configured limits are reached. HyperProbe supports JavaScript, TypeScript, Java, Kotlin, Python, and Ruby, and provides an MCP server for coding agents including Cursor, Claude Code, Codex, and Opencode.
HyperProbe can pick up an alert from PagerDuty, Datadog, or Slack, read logs and traces, locate a suspected code path, and plan the debugging flow.
A probe acts as a virtual breakpoint on a selected line and captures the exact variable state observed on real traffic without writing memory or executing code.
Each probe supports a time-to-live, rate limit, and hit-expiry count. The probe clears when one of those limits is reached, helping bound collection on high-traffic services.
The SDK and probe workflow are intended to inspect a running service without adding a log line, restarting the process, or pausing request threads.
An MCP server lets supported coding agents drive probe placement and use the captured evidence during an investigation. The site says installation can be initiated through a prompt to a coding agent and typically takes about 15 minutes.
Default PII redaction runs at the agent before capture, and every probe is recorded in an immutable audit trail. Enterprise adds custom redaction rules, approval gates, and organisation-level policy ceilings.
Inspect values behind successful responses with incorrect content, swallowed exceptions, or business metrics that decline without an alert.
Capture state during a live spike or race condition when reproducing the problem locally would take too long or fail to reproduce the timing.
Follow an alert through logs and traces, then inspect a downstream or upstream handler when the stack trace points away from the actual cause.
Examine live request data when a vendor introduces a new status or field that the application does not handle.
It captures a read-only snapshot of live variable state at a specific line when the probe is reached by real traffic. The probe cannot write memory or execute code.
No. The site describes probes as asynchronous and non-blocking, with no thread pauses or request waits. HyperProbe is designed to work without redeploying or restarting the service.
Every probe has a time-to-live, rate limit, and hit-expiry setting. It clears when any configured limit is reached. Enterprise can also apply organisation-level ceilings and approval policies.
The listed runtimes are JavaScript, TypeScript, Java, Kotlin, Python, and Ruby. The site lists Cursor, Claude Code, Codex, and Opencode as supported coding agents through its MCP server. Go is on the roadmap.
Yes, on Enterprise. The control plane and capture store can run in the customer’s VPC, with the site stating that captured values do not leave that network. Managed cloud deployment is available on the Free and Professional plans.
트래픽 데이터는 참고용으로만 확인하세요.