
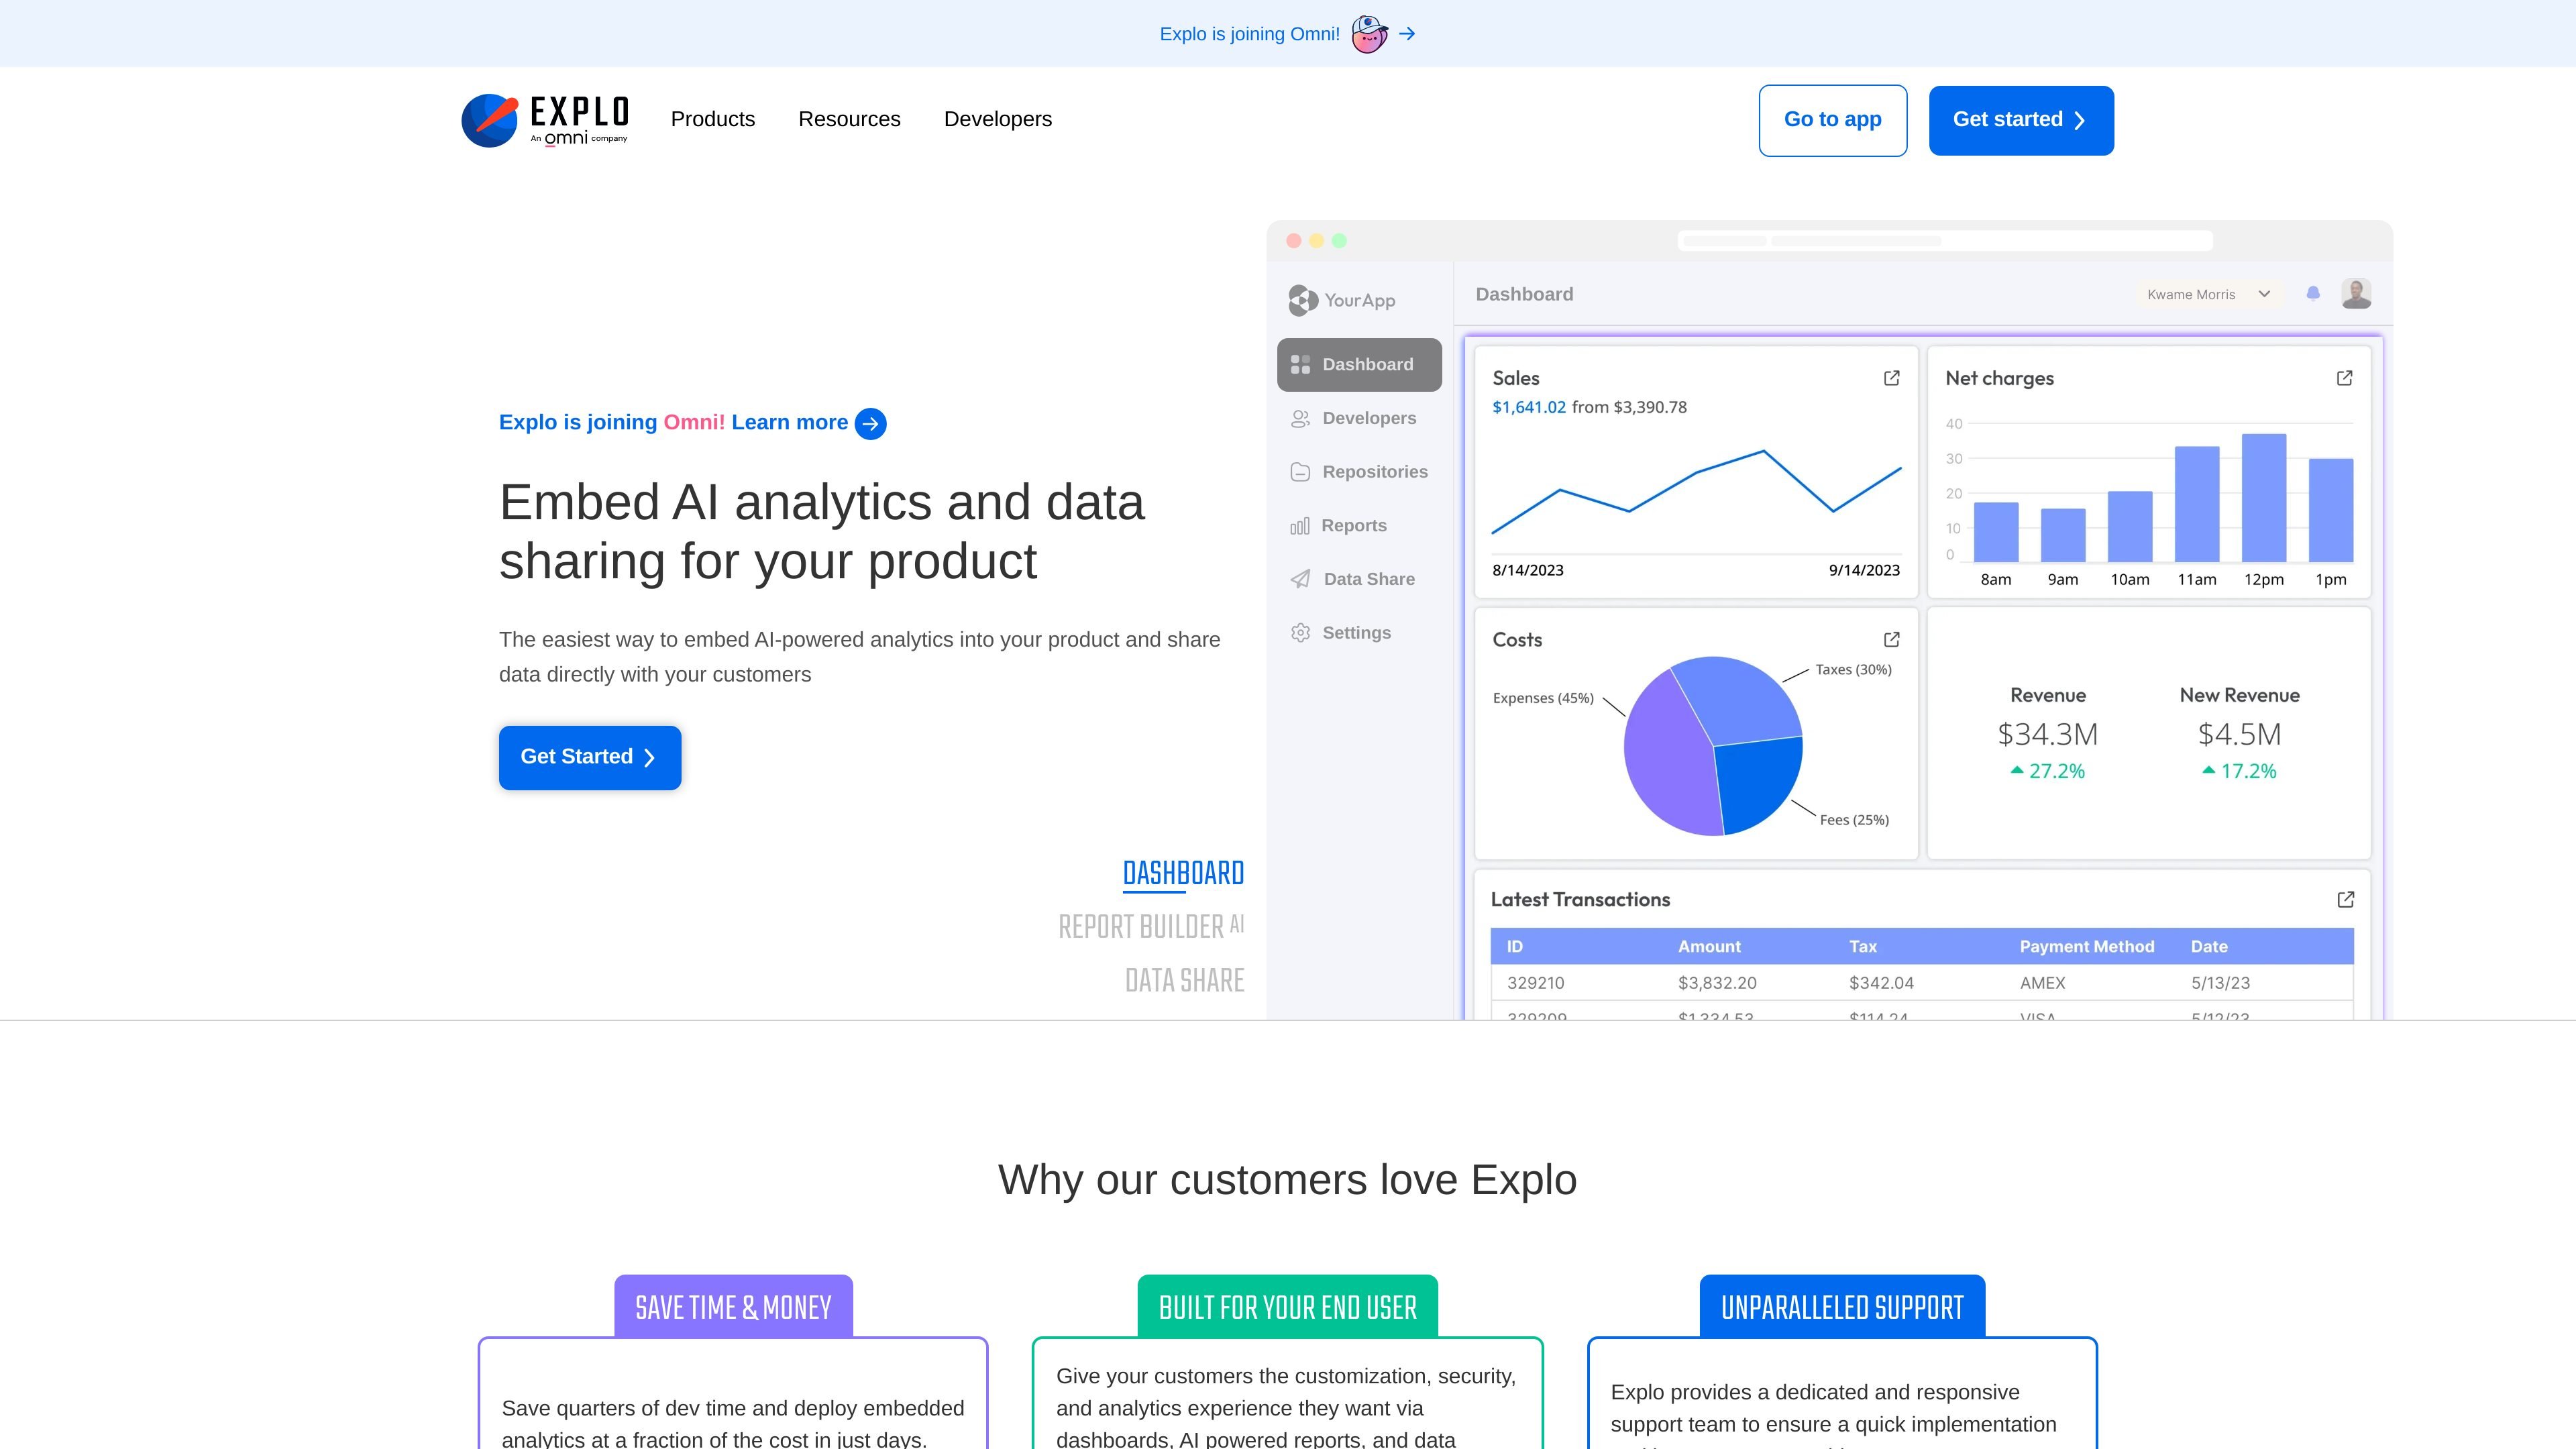
Embedded dashboards
Embed interactive dashboards into your product with filters, drill-downs, charts, tables, and other exploration tools so customers can analyze data in place.

Analytics integrata per dashboard rivolte ai clienti e report self-service
Explo is an embedded analytics platform for customer-facing dashboards, self-serve reporting, and data sharing inside SaaS products. The site positions it for product and engineering teams that need to deliver analytics experiences to their own users without building everything from scratch.
The product combines dashboards, Report Builder AI, Data Share, and a library of database integrations. It supports direct connections to relational databases and warehouses, and it includes styling controls, embedding options, and change-management tools so teams can fit analytics into an existing application and workflow.
Embed interactive dashboards into your product with filters, drill-downs, charts, tables, and other exploration tools so customers can analyze data in place.
Let end users generate reports with natural language and ask questions against their data inside the application.
Share reports and exports through Data Share, including delivery methods such as email or share links, so customers can receive data when they need it.
Style components to match the host application, including fonts, spacing, shadows, colors, and other visual settings.
Connect directly to SQL data sources and supported databases or warehouses without replicating data into a separate model first.
Use version control, environment tags, publishing, and revert flows to manage dashboard and report changes over time.
Build customer-facing dashboards with filters, drill-downs, and branded visuals so users can explore product or business data inside the app.
Let customers ask questions in natural language and generate contextual reports without leaving the product.
Send reports or exports through scheduled or on-demand delivery so users receive data in formats they can use in meetings or offline analysis.
Connect directly to existing SQL databases and warehouses when teams want to avoid data replication and keep analytics close to the source.
Manage dashboard and report updates with version control, environment tags, and publishing workflows for production changes.
Explo supports direct connections to relational databases and data warehouses, so teams can embed dashboards and reporting without replicating data into a separate analytics system.
The source pages show embedded dashboards, Report Builder AI, Data Share, and an integrations library. Together they cover in-app analytics, self-serve reporting, and data delivery to customers.
The dashboard product can be embedded with a web component or iFrame, and the report builder product is designed to let end users ask questions in natural language and generate reports inside the application.
The site states that Explo supports all relational databases and warehouses, and the integrations page lists database and warehouse options such as PostgreSQL, MySQL, Snowflake, BigQuery, Redshift, ClickHouse, and Databricks.
I dati sul traffico sono solo a scopo di riferimento.

getbruin.com
Piattaforma dati con IA per rispondere alle domande, creare dashboard e automatizzare azioni sui dati connessi, in cloud o in self-hosting.

othor.ai
Business intelligence nativa dell’AI con analisi automatica, chat, dashboard, briefing e report

engineroommedia.com
Engine Room is an analytics and business dashboard for creators that brings data from multiple publishing, social, subscription, and audience platforms into one workspace. It provides performance insights, traffic tracking, media kits, and monetization tools for creators and creator teams.