
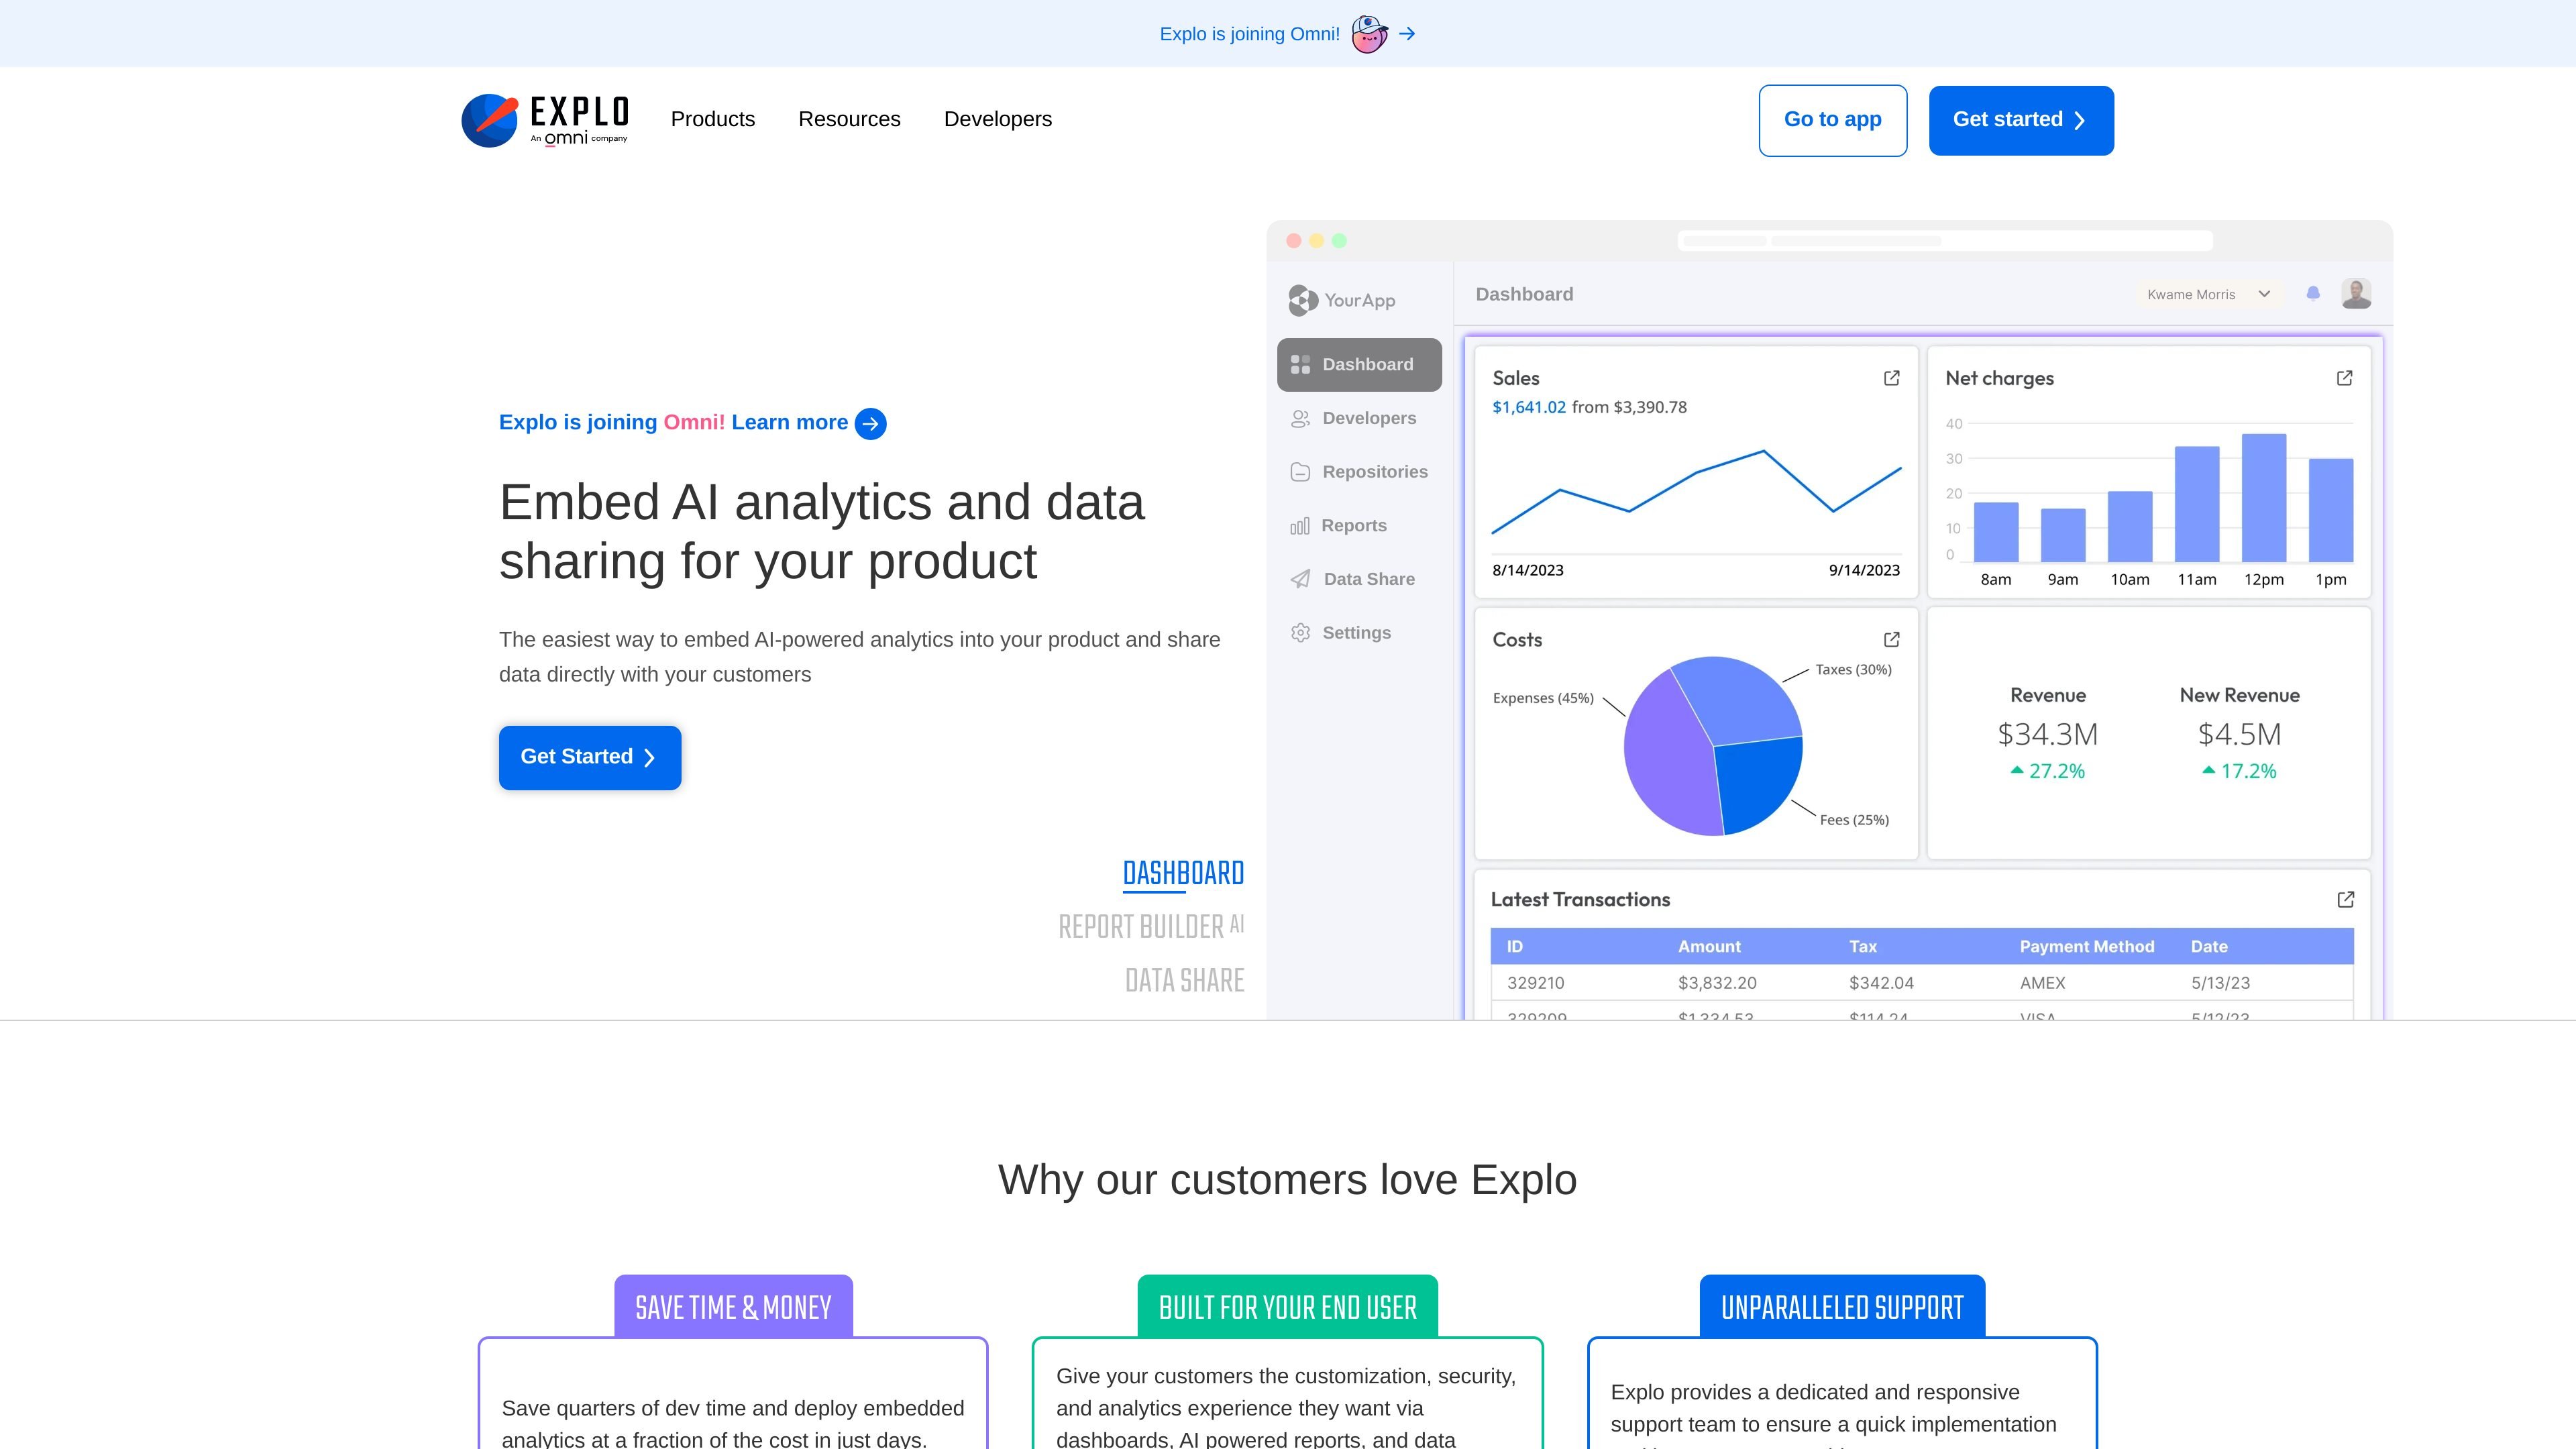
Embedded dashboards
Embed interactive dashboards into your product with filters, drill-downs, charts, tables, and other exploration tools so customers can analyze data in place.

Analytique intégrée pour tableaux de bord clients et rapports en libre-service
Explo is an embedded analytics platform for customer-facing dashboards, self-serve reporting, and data sharing inside SaaS products. The site positions it for product and engineering teams that need to deliver analytics experiences to their own users without building everything from scratch.
The product combines dashboards, Report Builder AI, Data Share, and a library of database integrations. It supports direct connections to relational databases and warehouses, and it includes styling controls, embedding options, and change-management tools so teams can fit analytics into an existing application and workflow.
Embed interactive dashboards into your product with filters, drill-downs, charts, tables, and other exploration tools so customers can analyze data in place.
Let end users generate reports with natural language and ask questions against their data inside the application.
Share reports and exports through Data Share, including delivery methods such as email or share links, so customers can receive data when they need it.
Style components to match the host application, including fonts, spacing, shadows, colors, and other visual settings.
Connect directly to SQL data sources and supported databases or warehouses without replicating data into a separate model first.
Use version control, environment tags, publishing, and revert flows to manage dashboard and report changes over time.
Build customer-facing dashboards with filters, drill-downs, and branded visuals so users can explore product or business data inside the app.
Let customers ask questions in natural language and generate contextual reports without leaving the product.
Send reports or exports through scheduled or on-demand delivery so users receive data in formats they can use in meetings or offline analysis.
Connect directly to existing SQL databases and warehouses when teams want to avoid data replication and keep analytics close to the source.
Manage dashboard and report updates with version control, environment tags, and publishing workflows for production changes.
Explo supports direct connections to relational databases and data warehouses, so teams can embed dashboards and reporting without replicating data into a separate analytics system.
The source pages show embedded dashboards, Report Builder AI, Data Share, and an integrations library. Together they cover in-app analytics, self-serve reporting, and data delivery to customers.
The dashboard product can be embedded with a web component or iFrame, and the report builder product is designed to let end users ask questions in natural language and generate reports inside the application.
The site states that Explo supports all relational databases and warehouses, and the integrations page lists database and warehouse options such as PostgreSQL, MySQL, Snowflake, BigQuery, Redshift, ClickHouse, and Databricks.
Les données de trafic sont fournies à titre indicatif uniquement.

getbruin.com
Plateforme de données avec IA pour répondre aux questions, créer des tableaux de bord et automatiser les actions sur les données connectées, dans le cloud ou en auto-hébergement.

askyourdatabase.com
AskYourDatabase est un analyste de données et chatbot SQL basé sur l’IA pour interroger les bases en langage naturel, créer des tableaux de bord et gérer les accès.

keak.com
Keak est une plateforme de tests A/B pour sites web et pages d’atterrissage, optimisée par l’IA. Elle aide les équipes à générer des variantes, mener des expériences et consulter les résultats grâce à des tableaux de bord actualisés et des alertes.

othor.ai
Business intelligence native à l’IA avec analyse automatisée, chat, tableaux de bord et rapports

optimizely.com
Plateforme d’IA pour les équipes marketing et digitales, avec CMS, expérimentation, personnalisation, analytique et automatisation agentique.

energent.ai
Outil d’analyse de données IA sans code qui transforme fichiers, documents et liens en analyses, données extraites et rapports exportables pour les activités, la finance et l’analyse documentaire.